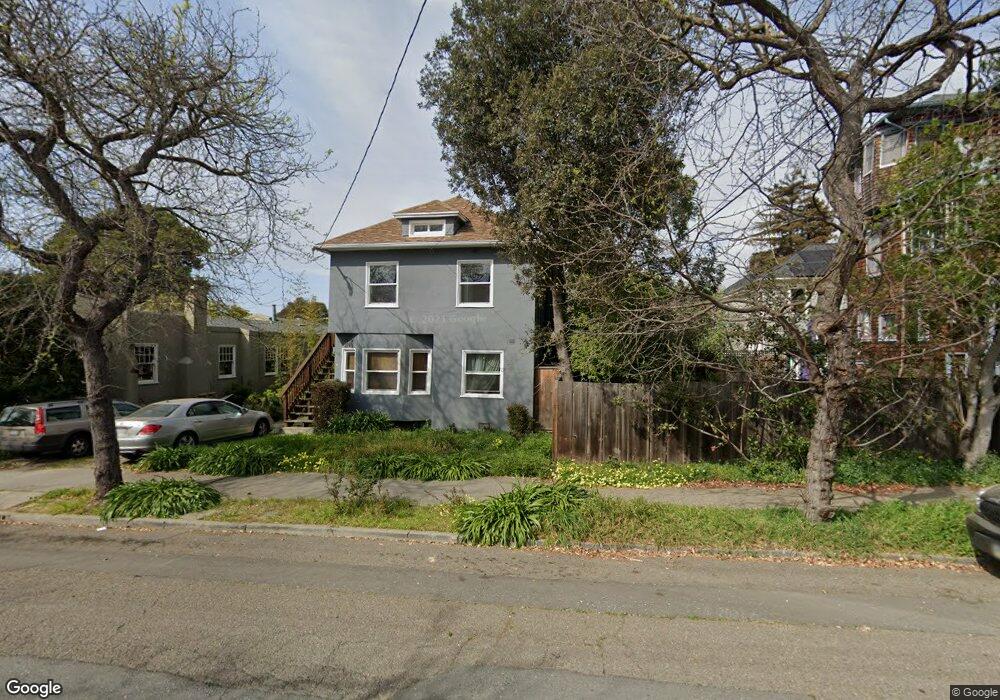
2145 Derby St Berkeley, CA 94705
South Berkeley NeighborhoodEstimated Value: $1,296,000 - $1,639,000
4
Beds
4
Baths
2,005
Sq Ft
$748/Sq Ft
Est. Value
About This Home
This home is located at 2145 Derby St, Berkeley, CA 94705 and is currently estimated at $1,500,644, approximately $748 per square foot. 2145 Derby St is a home located in Alameda County with nearby schools including Emerson Elementary School, Malcolm X Elementary School, and John Muir Elementary School.
Ownership History
Date
Name
Owned For
Owner Type
Purchase Details
Closed on
Feb 24, 2021
Sold by
Narahari Praneetha and Narahari Narasimha
Bought by
Narahari Praneetha and Narahari Narasimha
Current Estimated Value
Home Financials for this Owner
Home Financials are based on the most recent Mortgage that was taken out on this home.
Original Mortgage
$934,000
Outstanding Balance
$837,265
Interest Rate
2.7%
Mortgage Type
New Conventional
Estimated Equity
$663,379
Purchase Details
Closed on
Jun 1, 2018
Sold by
Orozco Gabriel and Eat 193 Inc
Bought by
Narahari Praneetha and Narahari Narasimha
Home Financials for this Owner
Home Financials are based on the most recent Mortgage that was taken out on this home.
Original Mortgage
$967,500
Interest Rate
4.6%
Mortgage Type
New Conventional
Purchase Details
Closed on
May 9, 2018
Sold by
Jenssem Leif Christopher and Alexander Desiree
Bought by
Security Eat 193 Inc
Home Financials for this Owner
Home Financials are based on the most recent Mortgage that was taken out on this home.
Original Mortgage
$967,500
Interest Rate
4.6%
Mortgage Type
New Conventional
Purchase Details
Closed on
May 16, 2011
Sold by
Orozco Gabriel and Mcbride Raena N
Bought by
Orozco Gabriel and Jenssen Leif Christopher
Home Financials for this Owner
Home Financials are based on the most recent Mortgage that was taken out on this home.
Original Mortgage
$416,450
Interest Rate
3.85%
Mortgage Type
New Conventional
Purchase Details
Closed on
Dec 8, 2009
Sold by
Jennsen Leif C
Bought by
Jenssen Leif Christopher and Alexander Desiree
Purchase Details
Closed on
Mar 12, 2003
Sold by
Ruzickby Joseph and Ruzick Joseph
Bought by
Orozco Gabriel and Jenssen Leif C
Home Financials for this Owner
Home Financials are based on the most recent Mortgage that was taken out on this home.
Original Mortgage
$472,400
Interest Rate
5.79%
Purchase Details
Closed on
May 16, 2002
Sold by
Rucker Joanne and Rucker Lee
Bought by
Ruzick Joseph and Ruzick Rosemarie Breen
Create a Home Valuation Report for This Property
The Home Valuation Report is an in-depth analysis detailing your home's value as well as a comparison with similar homes in the area
Home Values in the Area
Average Home Value in this Area
Purchase History
| Date | Buyer | Sale Price | Title Company |
|---|---|---|---|
| Narahari Praneetha | -- | First American Title Ins Co | |
| Narahari Praneetha | $1,290,000 | Chicago Title Company | |
| Security Eat 193 Inc | $625,000 | None Available | |
| Orozco Gabriel | -- | Servicelink | |
| Jenssen Leif Christopher | -- | None Available | |
| Orozco Gabriel | $525,000 | Old Republic Title Company | |
| Ruzick Joseph | -- | -- |
Source: Public Records
Mortgage History
| Date | Status | Borrower | Loan Amount |
|---|---|---|---|
| Open | Narahari Praneetha | $934,000 | |
| Closed | Narahari Praneetha | $967,500 | |
| Previous Owner | Orozco Gabriel | $416,450 | |
| Previous Owner | Orozco Gabriel | $472,400 |
Source: Public Records
Tax History
| Year | Tax Paid | Tax Assessment Tax Assessment Total Assessment is a certain percentage of the fair market value that is determined by local assessors to be the total taxable value of land and additions on the property. | Land | Improvement |
|---|---|---|---|---|
| 2025 | $20,582 | $1,438,994 | $431,698 | $1,007,296 |
| 2024 | $20,582 | $1,410,781 | $423,234 | $987,547 |
| 2023 | $20,172 | $1,383,124 | $414,937 | $968,187 |
| 2022 | $19,850 | $1,356,008 | $406,802 | $949,206 |
| 2021 | $19,919 | $1,329,421 | $398,826 | $930,595 |
| 2020 | $18,955 | $1,315,800 | $394,740 | $921,060 |
| 2019 | $18,321 | $1,290,000 | $387,000 | $903,000 |
| 2018 | $10,717 | $668,230 | $200,469 | $467,761 |
| 2017 | $10,321 | $655,131 | $196,539 | $458,592 |
| 2016 | $9,966 | $642,290 | $192,687 | $449,603 |
| 2015 | $9,833 | $632,645 | $189,793 | $442,852 |
| 2014 | $10,022 | $620,255 | $186,076 | $434,179 |
Source: Public Records
Map
Nearby Homes
- 2319 Ward St
- 2018 Blake St
- 2702 Dana St
- 2550 Dana St Unit 2F
- 2923 Wheeler St
- 2535 Chilton Way
- 2243 Ashby Ave
- 1901 Parker St Unit 3
- 2110 Ashby Ave
- 2917 Telegraph Ave
- 2057 Emerson St
- 2701 Grant St
- 2935 Florence St
- 3046 Deakin St
- 2509 Dwight Way
- 2124 Prince St
- 2643 Stuart St
- 2926 Ellis St
- 629 66th St
- 1634 Blake St
Your Personal Tour Guide
Ask me questions while you tour the home.