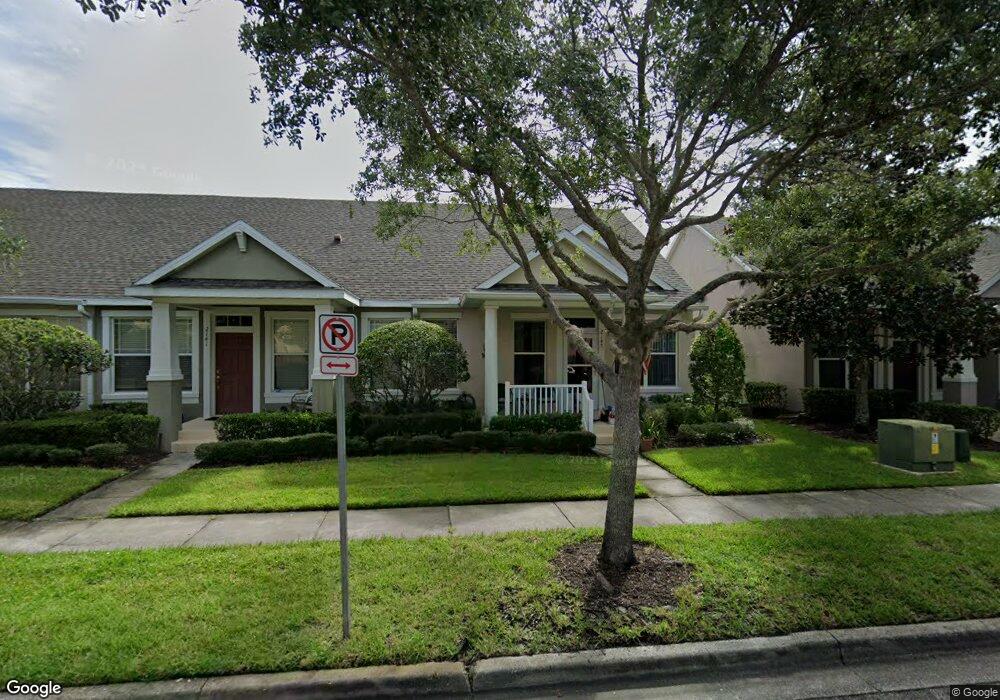
2145 Florida Soapberry Blvd Orlando, FL 32828
Estimated Value: $346,000 - $366,000
3
Beds
2
Baths
1,952
Sq Ft
$181/Sq Ft
Est. Value
About This Home
This home is located at 2145 Florida Soapberry Blvd, Orlando, FL 32828 and is currently estimated at $352,936, approximately $180 per square foot. 2145 Florida Soapberry Blvd is a home located in Orange County with nearby schools including Avalon Elementary School, Avalon Middle School, and Timber Creek High School.
Ownership History
Date
Name
Owned For
Owner Type
Purchase Details
Closed on
Jun 22, 2015
Sold by
U S Bank National Association
Bought by
Goldman Matthew
Current Estimated Value
Purchase Details
Closed on
Mar 24, 2015
Sold by
Waters Norah and Mortgage Electronic Registrati
Bought by
U S Bank National Association
Purchase Details
Closed on
Mar 13, 2007
Sold by
Fincke Matthew
Bought by
Waters Norah
Home Financials for this Owner
Home Financials are based on the most recent Mortgage that was taken out on this home.
Original Mortgage
$182,400
Interest Rate
7.2%
Mortgage Type
Purchase Money Mortgage
Purchase Details
Closed on
Jun 29, 2005
Sold by
The Ryland Group
Bought by
Fincke Matthew
Home Financials for this Owner
Home Financials are based on the most recent Mortgage that was taken out on this home.
Original Mortgage
$155,600
Interest Rate
5.54%
Mortgage Type
Fannie Mae Freddie Mac
Create a Home Valuation Report for This Property
The Home Valuation Report is an in-depth analysis detailing your home's value as well as a comparison with similar homes in the area
Home Values in the Area
Average Home Value in this Area
Purchase History
| Date | Buyer | Sale Price | Title Company |
|---|---|---|---|
| Goldman Matthew | $141,000 | Premium Title Services Inc | |
| U S Bank National Association | $96,600 | None Available | |
| Waters Norah | $228,000 | Aloma Title Company | |
| Fincke Matthew | $163,900 | Ryland Title Company |
Source: Public Records
Mortgage History
| Date | Status | Borrower | Loan Amount |
|---|---|---|---|
| Previous Owner | Waters Norah | $182,400 | |
| Previous Owner | Fincke Matthew | $155,600 |
Source: Public Records
Tax History Compared to Growth
Tax History
| Year | Tax Paid | Tax Assessment Tax Assessment Total Assessment is a certain percentage of the fair market value that is determined by local assessors to be the total taxable value of land and additions on the property. | Land | Improvement |
|---|---|---|---|---|
| 2025 | $4,962 | $291,409 | -- | -- |
| 2024 | $4,423 | $291,409 | -- | -- |
| 2023 | $4,423 | $293,434 | $55,000 | $238,434 |
| 2022 | $3,965 | $255,285 | $55,000 | $200,285 |
| 2021 | $3,485 | $199,036 | $40,000 | $159,036 |
| 2020 | $3,152 | $185,154 | $40,000 | $145,154 |
| 2019 | $3,086 | $171,039 | $40,000 | $131,039 |
| 2018 | $2,896 | $157,575 | $30,000 | $127,575 |
| 2017 | $2,862 | $154,204 | $30,000 | $124,204 |
| 2016 | $2,783 | $147,429 | $27,000 | $120,429 |
| 2015 | $2,521 | $129,105 | $27,000 | $102,105 |
| 2014 | -- | $123,068 | $27,000 | $96,068 |
Source: Public Records
Map
Nearby Homes
- 2163 Glossy Privet Dr
- 14626 Sweet Acacia Dr
- 2124 Florida Soapberry Blvd
- 14655 Water Locust Dr
- 14461 Chinese Elm Dr
- 14810 Sweet Acacia Dr
- 1721 Saffron Plum Ln
- 14339 Southern Red Maple Dr
- 14236 Golden Rain Tree Blvd
- 14242 Southern Red Maple Dr
- 16440 Cedar Run Dr
- 16044 Birchwood Way
- 953 Baron Rd
- 14084 Wild Majestic St
- 856 Timber Isle Dr
- 16178 Old Ash Loop
- 16307 Old Ash Loop
- 16118 Old Ash Loop
- 3363 Morelyn Crest Cir
- 829 Guy Rd
- 2141 Florida Soapberry Blvd
- 2149 Florida Soapberry Blvd
- 2137 Florida Soapberry Blvd
- 2133 Florida Soapberry Blvd Unit 280
- 2133 Florida Soapberry Blvd
- 2157 Florida Soapberry Blvd
- 2161 Florida Soapberry Blvd
- 2146 Glossy Privet Dr
- 2146 Glossy Privet Dr Unit 2146
- 2142 Glossy Privet Dr
- 2150 Glossy Privet Dr
- 2138 Glossy Privet Dr
- 2154 Glossy Privet Dr
- 2134 Glossy Privet Dr
- 2158 Glossy Privet Dr
- 2165 Florida Soapberry Blvd
- 2162 Glossy Privet Dr
- 2148 Florida Soapberry Blvd
- 2152 Florida Soapberry Blvd Unit 51