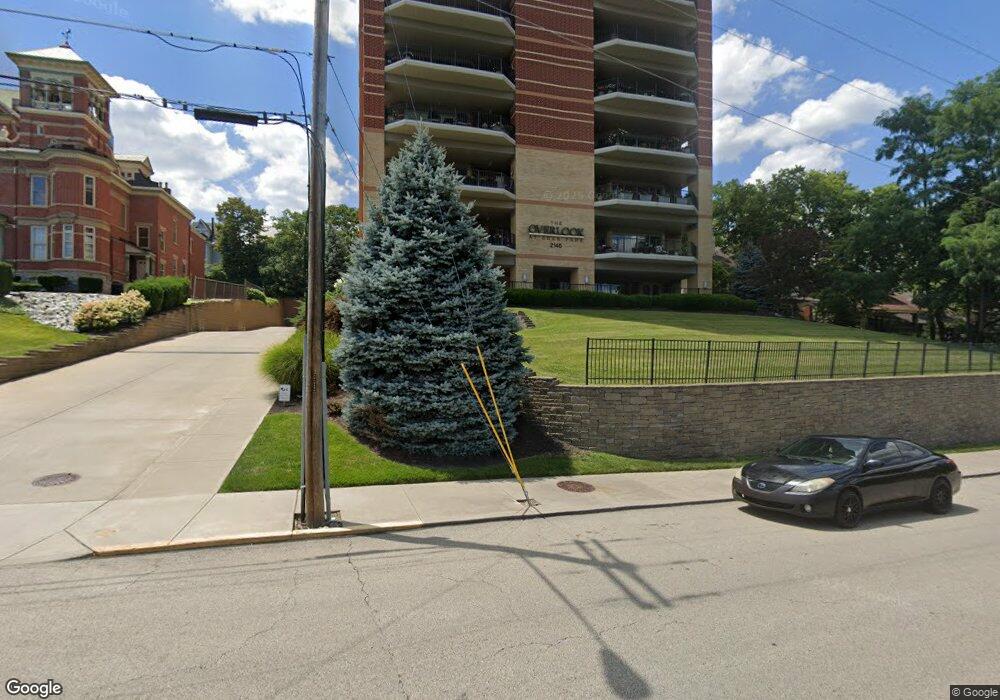
2145 Luray Ave Cincinnati, OH 45206
Walnut Hills NeighborhoodEstimated Value: $790,000 - $1,427,000
3
Beds
3
Baths
3,053
Sq Ft
$388/Sq Ft
Est. Value
About This Home
This home is located at 2145 Luray Ave, Cincinnati, OH 45206 and is currently estimated at $1,185,816, approximately $388 per square foot. 2145 Luray Ave is a home located in Hamilton County with nearby schools including Frederick Douglass Elementary School, Robert A. Taft Information Technology High School, and Clark Montessori High School.
Ownership History
Date
Name
Owned For
Owner Type
Purchase Details
Closed on
Jan 8, 2018
Sold by
Koenig Peter E and Koenig Amended Peter E
Bought by
Washburn James Todd and Washburn Mary Rita
Current Estimated Value
Home Financials for this Owner
Home Financials are based on the most recent Mortgage that was taken out on this home.
Original Mortgage
$792,000
Outstanding Balance
$653,957
Interest Rate
3.49%
Mortgage Type
Adjustable Rate Mortgage/ARM
Estimated Equity
$531,859
Purchase Details
Closed on
Jul 19, 2013
Sold by
Mb Real Estate Inc
Bought by
Koenig Peter E and Peter E Koenig Trust Amended & Restated
Purchase Details
Closed on
Jun 28, 2013
Sold by
The Overlook At Eden Park L P
Bought by
Mb Real Estate Inc and Mb Real Estate Delaware Inc
Purchase Details
Closed on
Jun 3, 2013
Sold by
The Overlook At Eden Park Lp
Bought by
Mb Real Estate Inc and Mb Real Estate Delaware Inc
Create a Home Valuation Report for This Property
The Home Valuation Report is an in-depth analysis detailing your home's value as well as a comparison with similar homes in the area
Home Values in the Area
Average Home Value in this Area
Purchase History
| Date | Buyer | Sale Price | Title Company |
|---|---|---|---|
| Washburn James Todd | $1,005,000 | None Available | |
| Koenig Peter E | $850,000 | Attorney | |
| Mb Real Estate Inc | -- | Attorney | |
| Mb Real Estate Inc | -- | None Available |
Source: Public Records
Mortgage History
| Date | Status | Borrower | Loan Amount |
|---|---|---|---|
| Open | Washburn James Todd | $792,000 |
Source: Public Records
Tax History
| Year | Tax Paid | Tax Assessment Tax Assessment Total Assessment is a certain percentage of the fair market value that is determined by local assessors to be the total taxable value of land and additions on the property. | Land | Improvement |
|---|---|---|---|---|
| 2025 | $23,256 | $378,483 | $63,000 | $315,483 |
| 2023 | $23,059 | $378,483 | $63,000 | $315,483 |
| 2022 | $16,312 | $351,750 | $31,500 | $320,250 |
| 2021 | $15,710 | $351,750 | $31,500 | $320,250 |
| 2020 | $16,172 | $351,750 | $31,500 | $320,250 |
| 2019 | $12,425 | $280,354 | $31,500 | $248,854 |
| 2018 | $12,444 | $280,354 | $31,500 | $248,854 |
| 2017 | $11,823 | $280,354 | $31,500 | $248,854 |
| 2016 | $13,208 | $297,500 | $31,500 | $266,000 |
| 2015 | $11,905 | $297,500 | $31,500 | $266,000 |
| 2014 | $11,991 | $297,500 | $31,500 | $266,000 |
| 2013 | $12,806 | $297,500 | $31,500 | $266,000 |
Source: Public Records
Map
Nearby Homes
- 2121 Alpine Place
- 2003 Calvin Cliff St Unit 5
- 2191 Victory Pkwy
- 2232 Kemper Ln
- 2116 Fulton Ave
- 2114 Fulton Ave
- 2100 Fulton Ave
- 2200 Victory Pkwy
- 967 Windsor St
- 965 Windsor St
- 915 Sharkey Ln Unit 8
- 964 Auburnview Dr
- 2334 Kemper Ln
- 1201 Edgecliff Place
- 933 Auburnview Dr Unit 5
- 911 Rogers Place
- 2156 Gilbert Ave
- 2226 Kenton St
- 2416 Riverside Dr
- 2356 Park Ave
- 2145 Luray Ave
- 2145 Luray Ave
- 2145 Luray Ave
- 2145 Luray Ave
- 2145 Luray Ave
- 2145 Luray Ave
- 2145 Luray Ave
- 2145 Luray Ave
- 2145 Luray Ave
- 2145 Luray Ave
- 2145 Luray Ave
- 2145 Luray Ave
- 2145 Luray Ave Unit 6N
- 2145 Luray Ave
- 2145 Luray Ave
- 2145 Luray Ave
- 2145 Luray Ave Unit 4N
- 2145 Luray Ave
- 2145 Luray Ave Unit 3N
- 2145 Luray Ave Unit 2S
Your Personal Tour Guide
Ask me questions while you tour the home.