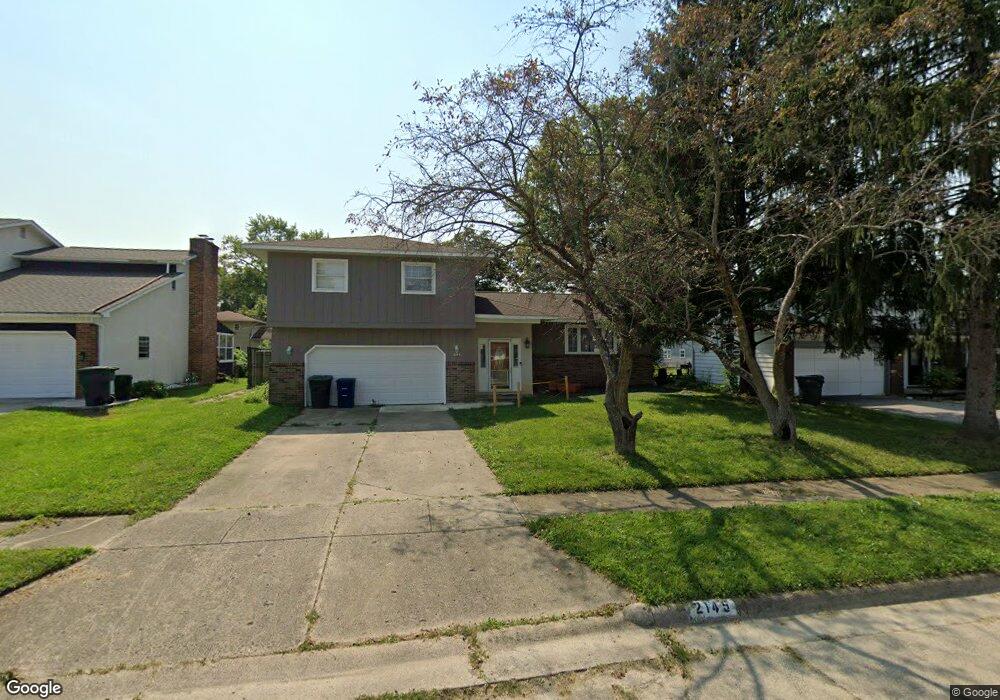
2145 Sumac Loop N Columbus, OH 43229
Forest Park East NeighborhoodEstimated Value: $319,744 - $376,000
4
Beds
3
Baths
2,324
Sq Ft
$146/Sq Ft
Est. Value
About This Home
This home is located at 2145 Sumac Loop N, Columbus, OH 43229 and is currently estimated at $339,936, approximately $146 per square foot. 2145 Sumac Loop N is a home located in Franklin County with nearby schools including Avalon Elementary School, Northgate Intermediate, and Woodward Park Middle School.
Ownership History
Date
Name
Owned For
Owner Type
Purchase Details
Closed on
Oct 11, 2017
Sold by
Ford Washington Roy L and Ford Washington Yona Y
Bought by
Mullen Adibeh and Mullen Tim
Current Estimated Value
Purchase Details
Closed on
Oct 5, 2017
Sold by
Washington Roy L and Oeven Loan Servicing Llc
Bought by
Mullen Adineh and Mullen Tim
Purchase Details
Closed on
Jun 30, 2006
Sold by
Shapter Peter D and Shapter Rita J
Bought by
Ford Washington Roy L and Ford Washington Yona Y
Home Financials for this Owner
Home Financials are based on the most recent Mortgage that was taken out on this home.
Original Mortgage
$160,000
Interest Rate
10.02%
Mortgage Type
Purchase Money Mortgage
Purchase Details
Closed on
Apr 4, 1988
Bought by
Shapter Peter D
Create a Home Valuation Report for This Property
The Home Valuation Report is an in-depth analysis detailing your home's value as well as a comparison with similar homes in the area
Home Values in the Area
Average Home Value in this Area
Purchase History
| Date | Buyer | Sale Price | Title Company |
|---|---|---|---|
| Mullen Adibeh | $118,000 | None Available | |
| Mullen Adineh | -- | None Available | |
| Ford Washington Roy L | $160,000 | Talon Group | |
| Shapter Peter D | $81,500 | -- |
Source: Public Records
Mortgage History
| Date | Status | Borrower | Loan Amount |
|---|---|---|---|
| Previous Owner | Ford Washington Roy L | $160,000 |
Source: Public Records
Tax History
| Year | Tax Paid | Tax Assessment Tax Assessment Total Assessment is a certain percentage of the fair market value that is determined by local assessors to be the total taxable value of land and additions on the property. | Land | Improvement |
|---|---|---|---|---|
| 2025 | $4,134 | $92,120 | $20,020 | $72,100 |
| 2024 | $4,134 | $92,120 | $20,020 | $72,100 |
| 2023 | $4,081 | $92,120 | $20,020 | $72,100 |
| 2022 | $3,601 | $69,440 | $13,510 | $55,930 |
| 2021 | $3,728 | $69,440 | $13,510 | $55,930 |
| 2020 | $3,824 | $69,440 | $13,510 | $55,930 |
| 2019 | $3,254 | $51,660 | $10,010 | $41,650 |
| 2018 | $3,107 | $51,660 | $10,010 | $41,650 |
| 2017 | $3,132 | $51,660 | $10,010 | $41,650 |
| 2016 | $2,912 | $43,960 | $9,380 | $34,580 |
| 2015 | $2,643 | $43,960 | $9,380 | $34,580 |
| 2014 | $2,650 | $43,960 | $9,380 | $34,580 |
| 2013 | $1,436 | $48,300 | $9,870 | $38,430 |
Source: Public Records
Map
Nearby Homes
- 2087 Teakwood Dr
- 5556 Parkshire Dr Unit 5556
- 5726 Beechcroft Rd Unit J
- 5732 Beechcroft Rd Unit B
- 5720 Beechcroft Rd Unit B
- 1862 Torchwood Dr
- 5486 Pine Bluff Rd
- 5705 Pine Tree St S Unit F
- 2251 Tuliptree Ave
- 5885 Beechcroft Rd Unit 306
- 5885 Beechcroft Rd Unit 114
- 1687 Brookfield Square S
- 5972 Maple Canyon Ave
- 1638 Arrowood Loop N
- 6019 Beechcroft Rd
- 2470 Carolina Ave Unit 66
- 5575 Karl Rd
- 1905 Denise Dr
- 1523 Hempwood Dr
- 6048 Pinemoor St
- 2135 Sumac Loop N
- 2155 Sumac Loop N
- 2144 Sumac Loop S
- 2127 Sumac Loop N
- 2136 Sumac Loop S
- 2154 Sumac Loop S
- 2140 Sumac Loop N
- 2148 Sumac Loop N
- 2126 Sumac Loop S
- 2132 Sumac Loop N
- 2115 Sumac Loop N
- 2156 Sumac Loop N
- 2124 Sumac Loop N
- 2118 Sumac Loop S
- 5474 Sumac Loop E
- 5466 Sumac Loop E
- 5482 Sumac Loop E
- 5458 Sumac Loop S
- 2107 Sumac Loop N
- 2114 Sumac Loop N
Your Personal Tour Guide
Ask me questions while you tour the home.