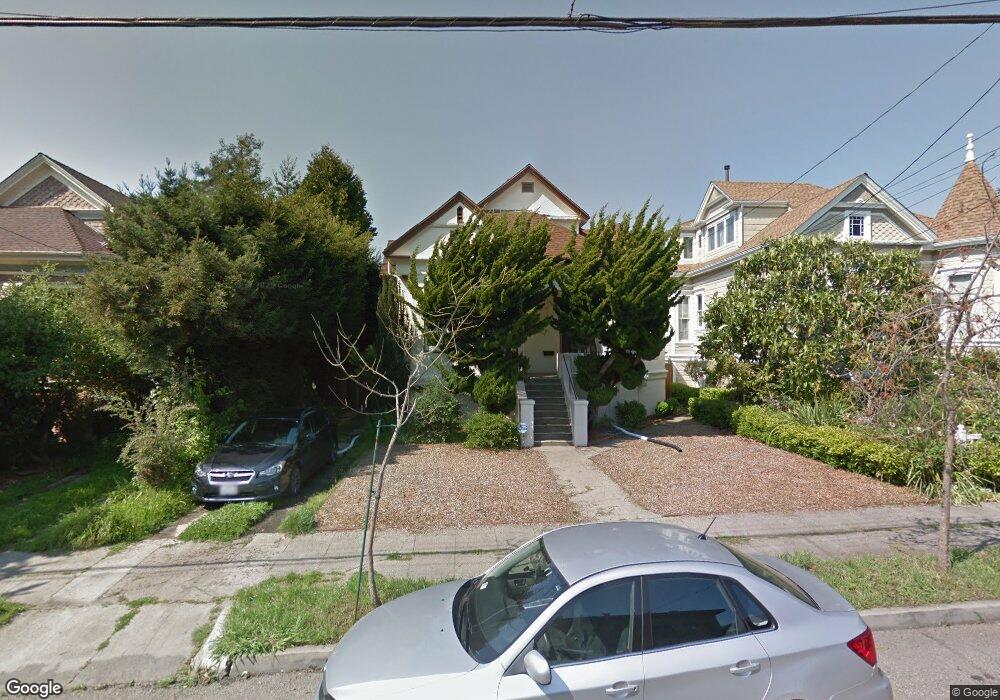
2145 Ward St Berkeley, CA 94705
South Berkeley NeighborhoodEstimated Value: $1,294,000 - $2,037,000
2
Beds
2
Baths
1,813
Sq Ft
$921/Sq Ft
Est. Value
About This Home
This home is located at 2145 Ward St, Berkeley, CA 94705 and is currently estimated at $1,670,153, approximately $921 per square foot. 2145 Ward St is a home located in Alameda County with nearby schools including Malcolm X Elementary School, Emerson Elementary School, and John Muir Elementary School.
Ownership History
Date
Name
Owned For
Owner Type
Purchase Details
Closed on
Nov 21, 2020
Sold by
Frydman Daniel I
Bought by
Frydman Daniel and The Daniel Frydman Living Trus
Current Estimated Value
Purchase Details
Closed on
May 29, 2020
Sold by
Frydman Daniel I and Trush Anita T
Bought by
Frydman Todaniel I
Purchase Details
Closed on
Apr 29, 2015
Sold by
Lusby Grace I and The Earl J Maccross 2009 Revoc
Bought by
Frydman Daniel I and Trush Anita T
Home Financials for this Owner
Home Financials are based on the most recent Mortgage that was taken out on this home.
Original Mortgage
$980,000
Interest Rate
3.64%
Mortgage Type
New Conventional
Purchase Details
Closed on
Oct 15, 2009
Sold by
Maccross Earl J
Bought by
Maccross Earl J and Lusby Grace I
Create a Home Valuation Report for This Property
The Home Valuation Report is an in-depth analysis detailing your home's value as well as a comparison with similar homes in the area
Home Values in the Area
Average Home Value in this Area
Purchase History
| Date | Buyer | Sale Price | Title Company |
|---|---|---|---|
| Frydman Daniel | -- | None Available | |
| Frydman Todaniel I | -- | None Available | |
| Frydman Daniel I | $1,225,000 | Old Republic Title Company | |
| Maccross Earl J | -- | None Available |
Source: Public Records
Mortgage History
| Date | Status | Borrower | Loan Amount |
|---|---|---|---|
| Previous Owner | Frydman Daniel I | $980,000 |
Source: Public Records
Tax History
| Year | Tax Paid | Tax Assessment Tax Assessment Total Assessment is a certain percentage of the fair market value that is determined by local assessors to be the total taxable value of land and additions on the property. | Land | Improvement |
|---|---|---|---|---|
| 2025 | $22,314 | $1,465,217 | $441,665 | $1,030,552 |
| 2024 | $22,314 | $1,436,355 | $433,006 | $1,010,349 |
| 2023 | $21,800 | $1,415,058 | $424,517 | $990,541 |
| 2022 | $21,366 | $1,380,311 | $416,193 | $971,118 |
| 2021 | $21,428 | $1,353,117 | $408,035 | $952,082 |
| 2020 | $20,350 | $1,346,176 | $403,853 | $942,323 |
| 2019 | $19,619 | $1,319,790 | $395,937 | $923,853 |
| 2018 | $19,291 | $1,293,917 | $388,175 | $905,742 |
| 2017 | $18,641 | $1,268,548 | $380,564 | $887,984 |
| 2016 | $18,101 | $1,243,680 | $373,104 | $870,576 |
| 2015 | $3,776 | $73,186 | $46,105 | $27,081 |
| 2014 | $3,703 | $71,753 | $45,202 | $26,551 |
Source: Public Records
Map
Nearby Homes
- 2319 Ward St
- 2018 Blake St
- 2923 Wheeler St
- 2702 Dana St
- 2110 Ashby Ave
- 2243 Ashby Ave
- 2550 Dana St Unit 2F
- 1901 Parker St Unit 3
- 2057 Emerson St
- 2917 Telegraph Ave
- 2535 Chilton Way
- 2701 Grant St
- 3046 Deakin St
- 2935 Florence St
- 2124 Prince St
- 2509 Dwight Way
- 2926 Ellis St
- 629 66th St
- 6555 Shattuck Ave
- 1634 Blake St
Your Personal Tour Guide
Ask me questions while you tour the home.