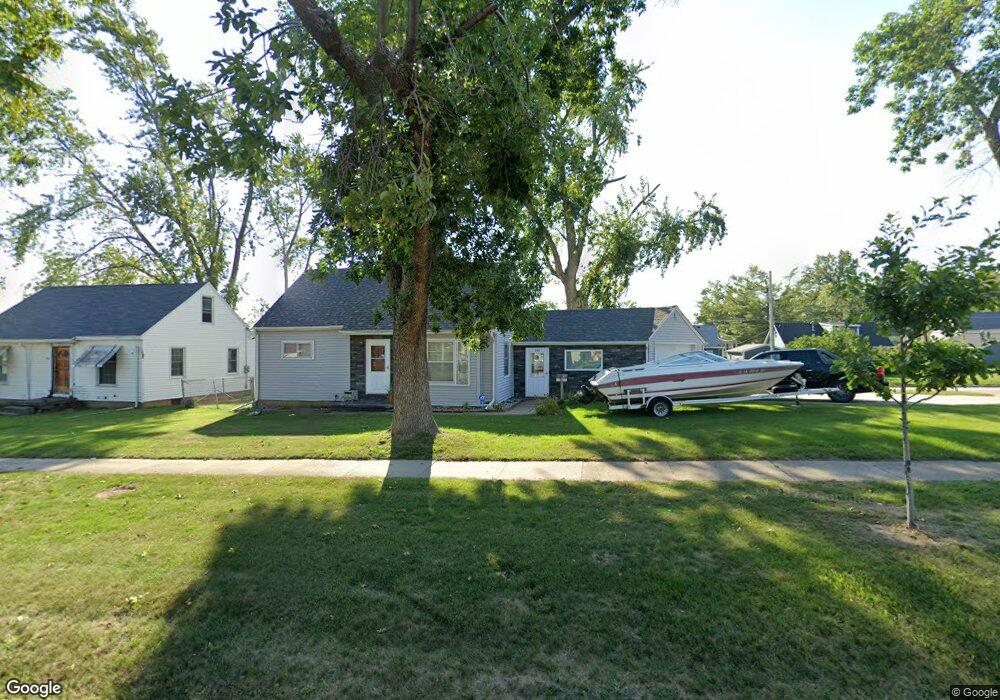
2145 Williams Blvd SW Cedar Rapids, IA 52404
Cleveland Area NeighborhoodEstimated Value: $149,000 - $163,941
3
Beds
1
Bath
983
Sq Ft
$160/Sq Ft
Est. Value
About This Home
This home is located at 2145 Williams Blvd SW, Cedar Rapids, IA 52404 and is currently estimated at $156,985, approximately $159 per square foot. 2145 Williams Blvd SW is a home located in Linn County with nearby schools including Junction City Elementary School, Cleveland Elementary School, and Kentucky Tech - Ashland Reg Tech Center.
Ownership History
Date
Name
Owned For
Owner Type
Purchase Details
Closed on
May 28, 2004
Sold by
Hud
Bought by
Jaspers John J
Current Estimated Value
Home Financials for this Owner
Home Financials are based on the most recent Mortgage that was taken out on this home.
Original Mortgage
$66,400
Outstanding Balance
$30,529
Interest Rate
5.12%
Mortgage Type
Unknown
Estimated Equity
$126,456
Purchase Details
Closed on
Jul 8, 2003
Sold by
Pelton Darell L and Pelton Amy L
Bought by
Cendant Mortgage Corp
Purchase Details
Closed on
May 24, 2000
Sold by
Parks Hunter P
Bought by
Parks Hunter P and Parks Trevor
Purchase Details
Closed on
Mar 29, 1999
Sold by
Behrens Mark L and Behrens Vanessa K
Bought by
Pelton Darrell R and Pelton Amy L
Home Financials for this Owner
Home Financials are based on the most recent Mortgage that was taken out on this home.
Original Mortgage
$76,711
Interest Rate
6.89%
Mortgage Type
FHA
Create a Home Valuation Report for This Property
The Home Valuation Report is an in-depth analysis detailing your home's value as well as a comparison with similar homes in the area
Home Values in the Area
Average Home Value in this Area
Purchase History
| Date | Buyer | Sale Price | Title Company |
|---|---|---|---|
| Jaspers John J | -- | -- | |
| Cendant Mortgage Corp | $92,050 | -- | |
| Parks Hunter P | -- | -- | |
| Pelton Darrell R | $75,000 | -- |
Source: Public Records
Mortgage History
| Date | Status | Borrower | Loan Amount |
|---|---|---|---|
| Open | Jaspers John J | $66,400 | |
| Previous Owner | Pelton Darrell R | $76,711 | |
| Closed | Jaspers John J | $12,450 |
Source: Public Records
Tax History Compared to Growth
Tax History
| Year | Tax Paid | Tax Assessment Tax Assessment Total Assessment is a certain percentage of the fair market value that is determined by local assessors to be the total taxable value of land and additions on the property. | Land | Improvement |
|---|---|---|---|---|
| 2025 | $2,580 | $167,900 | $36,000 | $131,900 |
| 2024 | $2,710 | $159,100 | $32,700 | $126,400 |
| 2023 | $2,710 | $156,300 | $32,700 | $123,600 |
| 2022 | $2,528 | $137,400 | $27,800 | $109,600 |
| 2021 | $2,582 | $131,000 | $27,800 | $103,200 |
| 2020 | $2,582 | $125,600 | $26,200 | $99,400 |
| 2019 | $2,304 | $115,400 | $26,200 | $89,200 |
| 2018 | $2,236 | $115,400 | $26,200 | $89,200 |
| 2017 | $2,149 | $111,800 | $26,200 | $85,600 |
| 2016 | $2,149 | $101,100 | $26,200 | $74,900 |
| 2015 | $2,151 | $101,134 | $26,173 | $74,961 |
| 2014 | $1,966 | $104,290 | $26,173 | $78,117 |
| 2013 | $1,986 | $104,290 | $26,173 | $78,117 |
Source: Public Records
Map
Nearby Homes
- 2437 9th Ave SW
- 2178 Chandler St SW
- 2433 8th Ave SW
- 1253 20th St SW
- 1832 8th Ave SW
- 1807 9th Ave SW
- 1206 18th St SW
- Remington - Cedar Rapids Plan at Whispering Pines
- Copeland Plan at Whispering Pines
- Meadowbrook - Cedar Rapids Plan at Stags Leap Estates
- Caldwell Plan at Stags Leap Estates
- Concord - Cedar Rapids Plan at Stags Leap Estates
- Yuma Expanded Plan at Whispering Pines
- Becker II Plan at Kirkwood Village - Kirk Wood Village
- Meadowbrook - Cedar Rapids Plan at Whispering Pines
- Richland Plan at Stags Leap Estates
- Prescott - Cedar Rapids Plan at Stags Leap Estates
- Becker Plan at Kirkwood Village - Kirk Wood Village
- Bakersfield - Cedar Rapids Plan at Whispering Pines
- Cedar Plan at Stags Leap Estates
- 2141 Williams Blvd SW
- 2135 Williams Blvd SW
- 2110 Chandler St SW
- 2121 10th Ave SW
- 2100 10th Ave SW
- 2120 Chandler St SW
- 2127 Williams Blvd SW
- 2148 Williams Blvd SW
- 2142 Williams Blvd SW
- 2136 Williams Blvd SW
- 2130 Chandler St SW
- 2160 Williams Blvd SW
- 2211 Williams Blvd SW
- 2040 Chandler St SW
- 2130 Williams Blvd SW
- 2117 Williams Blvd SW
- 2138 Chandler St SW
- 2214 10th Ave SW
- 2126 Williams Blvd SW
- 2036 Chandler St SW