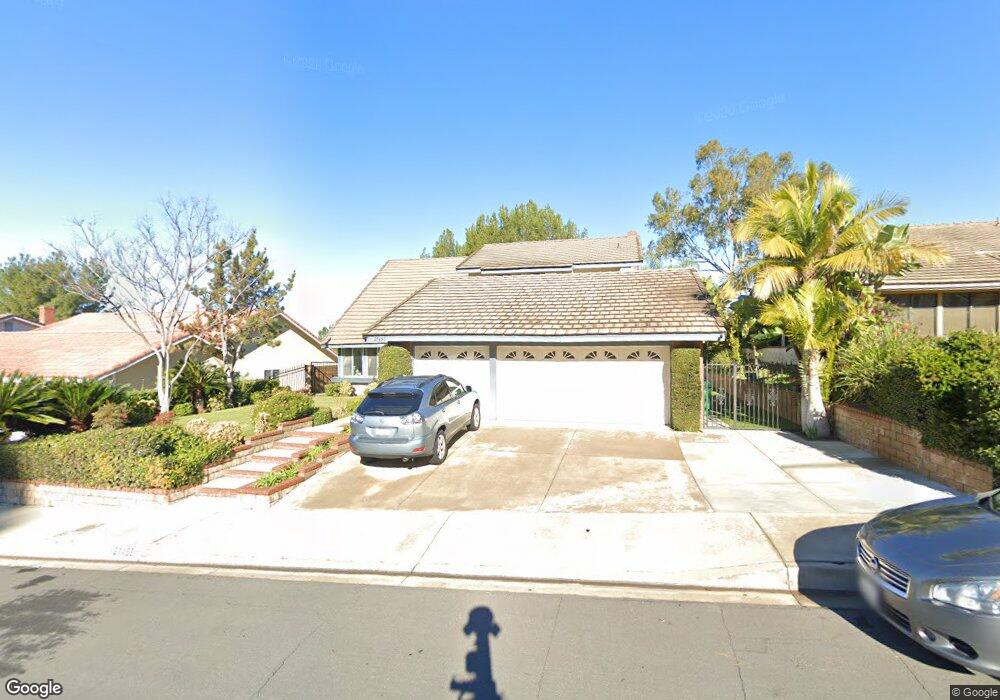
21455 Chirping Sparrow Rd Diamond Bar, CA 91765
Estimated Value: $1,428,000 - $1,841,000
5
Beds
3
Baths
3,159
Sq Ft
$502/Sq Ft
Est. Value
About This Home
This home is located at 21455 Chirping Sparrow Rd, Diamond Bar, CA 91765 and is currently estimated at $1,586,607, approximately $502 per square foot. 21455 Chirping Sparrow Rd is a home located in Los Angeles County with nearby schools including Castle Rock Elementary School, South Pointe Middle School, and Diamond Bar High School.
Ownership History
Date
Name
Owned For
Owner Type
Purchase Details
Closed on
Oct 10, 2021
Sold by
Tsang Kenneth and Huang Linda
Bought by
Kenneth Tsang And Linda Lin Ya Huang Revocabl and Tsang
Current Estimated Value
Purchase Details
Closed on
Mar 28, 2011
Sold by
Song Ok Jin
Bought by
Tsang Kenneth J and Huang Linda
Home Financials for this Owner
Home Financials are based on the most recent Mortgage that was taken out on this home.
Original Mortgage
$560,000
Interest Rate
4.84%
Mortgage Type
New Conventional
Purchase Details
Closed on
Feb 23, 2000
Sold by
Black J Ralph Inc Def Ben Plan
Bought by
Song Ok Jin and Song Ja Kyung
Home Financials for this Owner
Home Financials are based on the most recent Mortgage that was taken out on this home.
Original Mortgage
$276,800
Interest Rate
8.26%
Purchase Details
Closed on
Jun 21, 1995
Sold by
Title Transfer Inc
Bought by
J Ralph Black Md Inc Defined Benefit Pla
Create a Home Valuation Report for This Property
The Home Valuation Report is an in-depth analysis detailing your home's value as well as a comparison with similar homes in the area
Home Values in the Area
Average Home Value in this Area
Purchase History
| Date | Buyer | Sale Price | Title Company |
|---|---|---|---|
| Kenneth Tsang And Linda Lin Ya Huang Revocabl | -- | None Listed On Document | |
| Tsang Kenneth J | $720,000 | Fidelity Van Nuys | |
| Song Ok Jin | $346,000 | American Title Co | |
| J Ralph Black Md Inc Defined Benefit Pla | $155,217 | Chicago Title Co |
Source: Public Records
Mortgage History
| Date | Status | Borrower | Loan Amount |
|---|---|---|---|
| Previous Owner | Tsang Kenneth J | $560,000 | |
| Previous Owner | Song Ok Jin | $276,800 |
Source: Public Records
Tax History Compared to Growth
Tax History
| Year | Tax Paid | Tax Assessment Tax Assessment Total Assessment is a certain percentage of the fair market value that is determined by local assessors to be the total taxable value of land and additions on the property. | Land | Improvement |
|---|---|---|---|---|
| 2025 | $11,134 | $922,437 | $365,388 | $557,049 |
| 2024 | $11,134 | $904,351 | $358,224 | $546,127 |
| 2023 | $10,867 | $886,619 | $351,200 | $535,419 |
| 2022 | $10,641 | $869,235 | $344,314 | $524,921 |
| 2021 | $10,437 | $852,192 | $337,563 | $514,629 |
| 2019 | $10,105 | $826,917 | $327,551 | $499,366 |
| 2018 | $9,724 | $810,704 | $321,129 | $489,575 |
| 2016 | $8,995 | $779,225 | $308,660 | $470,565 |
| 2015 | $9,050 | $767,521 | $304,024 | $463,497 |
| 2014 | $9,057 | $752,487 | $298,069 | $454,418 |
Source: Public Records
Map
Nearby Homes
- 21533 Ambushers St
- 21307 Chirping Sparrow Rd
- 21187 Ambushers St
- 3201 Marigold Cir
- 3101 Marigold Cir
- 20905 Running Branch Rd
- 3005 La Paz Ln Unit C
- 2968 Crooked Creek Dr
- 2905 Yucatan Place Unit A
- 2990 Malaga Cir Unit C
- 3702 Crooked Creek Dr
- 2828 Water Course Dr
- 3145 Steeplechase Ln
- 2945 Steeplechase Ln
- 2831 Steeplechase Ln
- 2887 Shadow Canyon Rd
- 20610 E Oak Meadow Ln
- 2855 Oak Knoll Dr
- 2820 Shadow Canyon Rd
- 2710 Castle Rock Rd
- 21445 Chirping Sparrow Rd
- 21471 Chirping Sparrow Rd
- 21435 Chirping Sparrow Rd
- 21505 Chirping Sparrow Rd
- 21422 Running Branch Rd
- 21396 Running Branch Rd
- 21425 Chirping Sparrow Rd
- 21515 Chirping Sparrow Rd
- 21468 Chirping Sparrow Rd
- 21452 Chirping Sparrow Rd
- 21510 Chirping Sparrow Rd
- 21444 Chirping Sparrow Rd
- 21354 Running Branch Rd
- 21466 Running Branch Rd
- 21372 Running Branch Rd
- 21415 Chirping Sparrow Rd
- 21436 Chirping Sparrow Rd
- 21525 Chirping Sparrow Rd
- 21530 Chirping Sparrow Rd
- 21484 Running Branch Rd