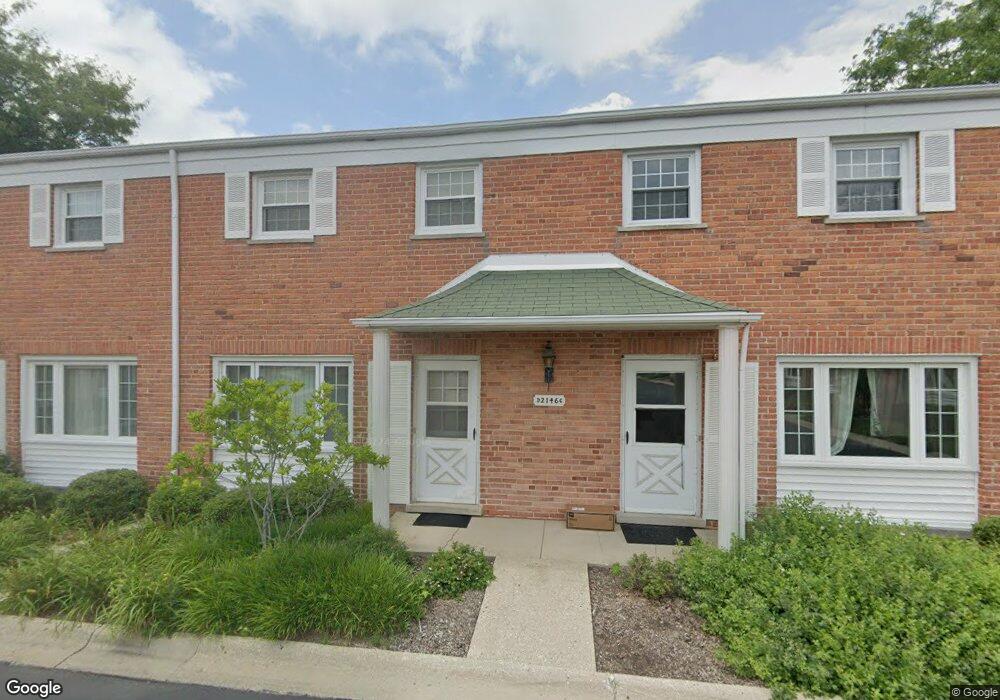
2146 Rugen Rd Unit C Glenview, IL 60026
The Glen NeighborhoodEstimated Value: $284,720 - $378,000
2
Beds
2
Baths
1,400
Sq Ft
$233/Sq Ft
Est. Value
About This Home
This home is located at 2146 Rugen Rd Unit C, Glenview, IL 60026 and is currently estimated at $326,430, approximately $233 per square foot. 2146 Rugen Rd Unit C is a home located in Cook County with nearby schools including Lyon Elementary School, Pleasant Ridge Elementary School, and Attea Middle School.
Ownership History
Date
Name
Owned For
Owner Type
Purchase Details
Closed on
Feb 21, 2007
Sold by
Kurber Cynthia L and Kurber Daniel M
Bought by
Park Min Hyok and Kwon Seran
Current Estimated Value
Home Financials for this Owner
Home Financials are based on the most recent Mortgage that was taken out on this home.
Original Mortgage
$164,000
Outstanding Balance
$98,828
Interest Rate
6.27%
Mortgage Type
New Conventional
Estimated Equity
$227,602
Purchase Details
Closed on
Jul 31, 2000
Sold by
Stjohn Jeffrey R and Stjohn Julie L
Bought by
Knasel Cynthia L
Home Financials for this Owner
Home Financials are based on the most recent Mortgage that was taken out on this home.
Original Mortgage
$153,900
Interest Rate
8.16%
Purchase Details
Closed on
Mar 28, 1996
Sold by
American National Bk & Tr Co Of Chicago
Bought by
Stjohn Jeffrey R and Stahlecker Julie J
Home Financials for this Owner
Home Financials are based on the most recent Mortgage that was taken out on this home.
Original Mortgage
$125,900
Interest Rate
7.36%
Mortgage Type
Balloon
Create a Home Valuation Report for This Property
The Home Valuation Report is an in-depth analysis detailing your home's value as well as a comparison with similar homes in the area
Home Values in the Area
Average Home Value in this Area
Purchase History
| Date | Buyer | Sale Price | Title Company |
|---|---|---|---|
| Park Min Hyok | $254,000 | Cti | |
| Knasel Cynthia L | $162,000 | -- | |
| Stjohn Jeffrey R | $139,000 | -- |
Source: Public Records
Mortgage History
| Date | Status | Borrower | Loan Amount |
|---|---|---|---|
| Open | Park Min Hyok | $164,000 | |
| Previous Owner | Knasel Cynthia L | $153,900 | |
| Previous Owner | Stjohn Jeffrey R | $125,900 |
Source: Public Records
Tax History Compared to Growth
Tax History
| Year | Tax Paid | Tax Assessment Tax Assessment Total Assessment is a certain percentage of the fair market value that is determined by local assessors to be the total taxable value of land and additions on the property. | Land | Improvement |
|---|---|---|---|---|
| 2024 | $3,801 | $20,490 | $6,155 | $14,335 |
| 2023 | $3,671 | $20,490 | $6,155 | $14,335 |
| 2022 | $3,671 | $20,490 | $6,155 | $14,335 |
| 2021 | $3,571 | $17,677 | $2,954 | $14,723 |
| 2020 | $3,585 | $17,677 | $2,954 | $14,723 |
| 2019 | $3,337 | $19,429 | $2,954 | $16,475 |
| 2018 | $3,090 | $16,872 | $2,584 | $14,288 |
| 2017 | $3,021 | $16,872 | $2,584 | $14,288 |
| 2016 | $3,041 | $16,872 | $2,584 | $14,288 |
| 2015 | $2,445 | $12,889 | $2,092 | $10,797 |
| 2014 | $2,413 | $12,889 | $2,092 | $10,797 |
| 2013 | $2,325 | $12,889 | $2,092 | $10,797 |
Source: Public Records
Map
Nearby Homes
- 2156 Rugen Rd Unit A
- 1900 E Lake Ave
- 1341 Greenwillow Ln Unit C
- 1342 Pine St
- 1220 Depot St Unit 305
- 1220 Depot St Unit 109
- 1220 Depot St Unit 409
- 1735 Patriot Blvd
- 2137 Glenview Rd
- 2000 Chestnut Ave Unit 103
- 1088 Shermer Rd Unit DW
- 1429 Pebblecreek Dr Unit 171
- 1752 Maclean Ct
- 2701 Commons Dr Unit 210
- 1508 Pebblecreek Dr Unit 14
- 1891 Admiral Ct Unit 79
- 2146 Rugen Rd Unit 2146C
- 2146 Rugen Rd Unit 2146A
- 2146 Rugen Rd Unit 2146B
- 2146 Rugen Rd Unit 2146D
- 2146 Rugen Rd
- 2146 Rugen Rd Unit B
- 2146 Rugen Rd Unit A
- 2148 Rugen Rd Unit 2148C
- 2148 Rugen Rd Unit 2148A
- 2148 Rugen Rd Unit 2148B
- 2148 Rugen Rd Unit 2148D
- 2148 Rugen Rd Unit D
- 2148 Rugen Rd Unit C
- 2148 Rugen Rd Unit B
- 2148 Rugen Rd Unit A
- 2144 Rugen Rd Unit B
- 2144 Rugen Rd Unit D
- 2144 Rugen Rd Unit 2144D
- 2144 Rugen Rd Unit 2144B
- 2144 Rugen Rd Unit 2144C