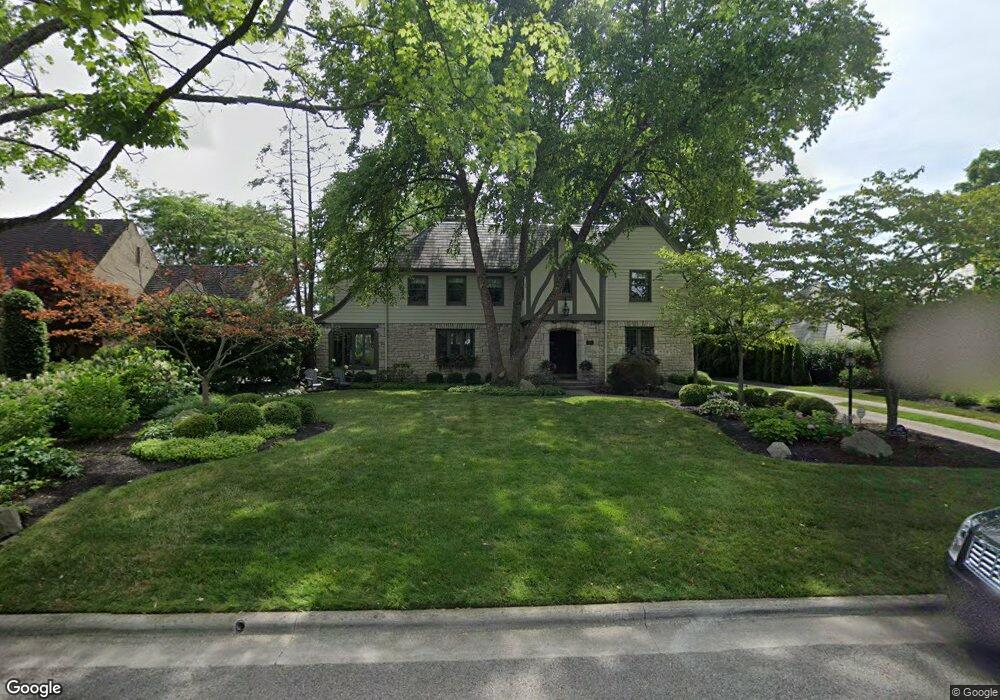
2147 Yorkshire Rd Columbus, OH 43221
Estimated Value: $1,392,000 - $1,842,000
5
Beds
4
Baths
3,731
Sq Ft
$430/Sq Ft
Est. Value
About This Home
This home is located at 2147 Yorkshire Rd, Columbus, OH 43221 and is currently estimated at $1,603,274, approximately $429 per square foot. 2147 Yorkshire Rd is a home located in Franklin County with nearby schools including Barrington Road Elementary School, Jones Middle School, and Upper Arlington High School.
Ownership History
Date
Name
Owned For
Owner Type
Purchase Details
Closed on
Aug 31, 2015
Sold by
Martin James M and Martin Lisa C
Bought by
Garvey Matthew L and Garvey Gina
Current Estimated Value
Home Financials for this Owner
Home Financials are based on the most recent Mortgage that was taken out on this home.
Original Mortgage
$968,000
Outstanding Balance
$763,658
Interest Rate
4.04%
Mortgage Type
Purchase Money Mortgage
Estimated Equity
$839,616
Purchase Details
Closed on
Oct 28, 2005
Sold by
Cox Maurice A and Cox Nancy A
Bought by
Martin James M and Martin Lisa C
Home Financials for this Owner
Home Financials are based on the most recent Mortgage that was taken out on this home.
Original Mortgage
$760,000
Interest Rate
5.12%
Mortgage Type
Fannie Mae Freddie Mac
Purchase Details
Closed on
Aug 15, 1986
Bought by
Cox Maurice A
Create a Home Valuation Report for This Property
The Home Valuation Report is an in-depth analysis detailing your home's value as well as a comparison with similar homes in the area
Home Values in the Area
Average Home Value in this Area
Purchase History
| Date | Buyer | Sale Price | Title Company |
|---|---|---|---|
| Garvey Matthew L | $1,210,000 | Expedient Title Ltd | |
| Martin James M | $990,000 | Talon Group | |
| Cox Maurice A | $236,100 | -- |
Source: Public Records
Mortgage History
| Date | Status | Borrower | Loan Amount |
|---|---|---|---|
| Open | Garvey Matthew L | $968,000 | |
| Closed | Martin James M | $760,000 |
Source: Public Records
Tax History Compared to Growth
Tax History
| Year | Tax Paid | Tax Assessment Tax Assessment Total Assessment is a certain percentage of the fair market value that is determined by local assessors to be the total taxable value of land and additions on the property. | Land | Improvement |
|---|---|---|---|---|
| 2024 | $31,711 | $547,760 | $132,340 | $415,420 |
| 2023 | $31,318 | $547,750 | $132,335 | $415,415 |
| 2022 | $32,203 | $460,850 | $86,520 | $374,330 |
| 2021 | $28,507 | $460,850 | $86,520 | $374,330 |
| 2020 | $28,254 | $460,850 | $86,520 | $374,330 |
| 2019 | $27,807 | $401,000 | $86,520 | $314,480 |
| 2018 | $21,720 | $387,700 | $86,520 | $301,180 |
| 2017 | $26,678 | $387,700 | $86,520 | $301,180 |
| 2016 | $16,723 | $252,920 | $73,470 | $179,450 |
| 2015 | $16,708 | $252,920 | $73,470 | $179,450 |
| 2014 | $16,727 | $252,920 | $73,470 | $179,450 |
| 2013 | $8,786 | $252,910 | $73,465 | $179,445 |
Source: Public Records
Map
Nearby Homes
- 2295 Oxford Rd
- 2063 Westover Rd
- 1932 Suffolk Rd Unit 1932
- 2276 Northwest Blvd
- 1934 Bedford Rd
- 2357 Keep Place Unit 2357
- 2593 Coventry Rd
- 2110 Northwest Blvd
- 1631 Roxbury Rd Unit D2
- 1631 Roxbury Rd Unit A1
- 1631 Roxbury Rd Unit B6
- 2015 W 5th Ave Unit 211
- 2015 W 5th Ave Unit 102
- 2015 W 5th Ave Unit 108
- 2615 Northwest Blvd
- 2754 Scioto Station Dr
- 1659 Tremont Rd
- 2704 Scioto Station Dr Unit 2704
- 1565 Berkshire Rd
- 2569 Chester Rd
- 2137 Yorkshire Rd
- 2155 Yorkshire Rd
- 2138 Cheshire Rd
- 2129 Yorkshire Rd
- 2130 Cheshire Rd
- 2120 Cheshire Rd
- 2148 Yorkshire Rd
- 2146 Cheshire Rd
- 2121 Yorkshire Rd
- 2205 Tewksbury Rd
- 2110 Cheshire Rd
- 2170 Yorkshire Rd
- 2156 Cheshire Rd
- 2179 Yorkshire Rd
- 2109 Yorkshire Rd
- 2124 Yorkshire Rd
- 2131 Cheshire Rd
- 2125 Cheshire Rd
- 2178 Yorkshire Rd
- 2100 Cheshire Rd