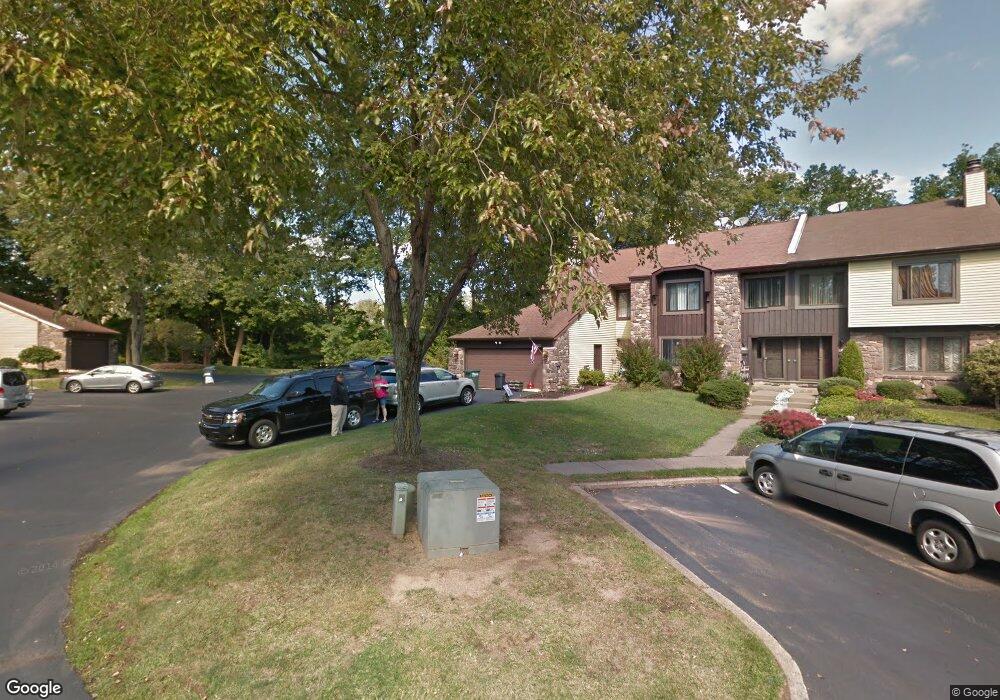
2148 Bromley Common Southampton, PA 18966
Estimated Value: $373,000 - $486,465
3
Beds
3
Baths
1,986
Sq Ft
$228/Sq Ft
Est. Value
About This Home
This home is located at 2148 Bromley Common, Southampton, PA 18966 and is currently estimated at $452,366, approximately $227 per square foot. 2148 Bromley Common is a home located in Bucks County with nearby schools including Hillcrest El School, Holland Middle School, and Council Rock High School - South.
Ownership History
Date
Name
Owned For
Owner Type
Purchase Details
Closed on
Dec 26, 2017
Sold by
Colella Louis J
Bought by
Colella Louis J and Colella Colleen
Current Estimated Value
Home Financials for this Owner
Home Financials are based on the most recent Mortgage that was taken out on this home.
Original Mortgage
$250,000
Outstanding Balance
$210,916
Interest Rate
3.93%
Mortgage Type
New Conventional
Estimated Equity
$241,450
Purchase Details
Closed on
Nov 4, 2013
Sold by
Collella L Jay and Estate Of Vivienne V Holden
Bought by
Colella Louis J
Home Financials for this Owner
Home Financials are based on the most recent Mortgage that was taken out on this home.
Original Mortgage
$140,000
Interest Rate
3.62%
Mortgage Type
Adjustable Rate Mortgage/ARM
Purchase Details
Closed on
Jun 22, 1990
Bought by
Holden
Create a Home Valuation Report for This Property
The Home Valuation Report is an in-depth analysis detailing your home's value as well as a comparison with similar homes in the area
Home Values in the Area
Average Home Value in this Area
Purchase History
| Date | Buyer | Sale Price | Title Company |
|---|---|---|---|
| Colella Louis J | -- | Attleboro Abstract Co | |
| Colella Louis J | -- | None Available | |
| Holden | $155,000 | -- |
Source: Public Records
Mortgage History
| Date | Status | Borrower | Loan Amount |
|---|---|---|---|
| Open | Colella Louis J | $250,000 | |
| Closed | Colella Louis J | $140,000 |
Source: Public Records
Tax History Compared to Growth
Tax History
| Year | Tax Paid | Tax Assessment Tax Assessment Total Assessment is a certain percentage of the fair market value that is determined by local assessors to be the total taxable value of land and additions on the property. | Land | Improvement |
|---|---|---|---|---|
| 2025 | $6,094 | $31,640 | $3,000 | $28,640 |
| 2024 | $6,094 | $31,640 | $3,000 | $28,640 |
| 2023 | $5,744 | $31,640 | $3,000 | $28,640 |
| 2022 | $5,691 | $31,640 | $3,000 | $28,640 |
| 2021 | $5,511 | $31,640 | $3,000 | $28,640 |
| 2020 | $5,387 | $31,640 | $3,000 | $28,640 |
| 2019 | $5,156 | $31,640 | $3,000 | $28,640 |
| 2018 | $5,065 | $31,640 | $3,000 | $28,640 |
| 2017 | $4,869 | $31,640 | $3,000 | $28,640 |
| 2016 | -- | $31,640 | $3,000 | $28,640 |
| 2015 | -- | $31,640 | $3,000 | $28,640 |
| 2014 | -- | $31,640 | $3,000 | $28,640 |
Source: Public Records
Map
Nearby Homes
- 80 Hershey Ct
- 60 Signal Hill Rd
- 281 E Village Rd
- 10014 Beacon Hill Dr Unit 7
- 501 Heritage Place Unit 1
- 9015 Heritage Dr Unit 8
- 31 Hillcroft Way
- 1016 Diamond Dr Unit 1016
- 104 Cornell Rd
- 15 Dover Place
- 501 Potters Ct
- 35 Hanover Ct
- 210 E Hanover St
- 21 Tree Bark Ln
- 163 Leedom Way Unit 25
- 180 Independence Dr
- 8 Dunham Ln
- 137 Coach Rd
- 440 S State St Unit D3
- 41019 Coopers Place Unit 9
- 2146 Bromley Common
- 2145 Bromley Common
- 2147 Bromley Common
- 2150 Bromley Common
- 2151 Bromley Common
- 2149 Bromley Common
- 2152 Bromley Common
- 2153 Bromley Common
- 2153 Bromley Common
- 2157 Bromley Common
- 2156 Bromley Common
- 2141 Bromley Common
- 2140 Bromley Common
- 2142 Bromley Common
- 2143 Bromley Common
- 2154 Bromley Common
- 2144 Bromley Common
- 2164 Henley Common
- 2155 Bromley Common
- 2166 Henley Common