2148 Morley St Simi Valley, CA 93065
Central Simi Valley NeighborhoodEstimated Value: $795,000 - $827,000
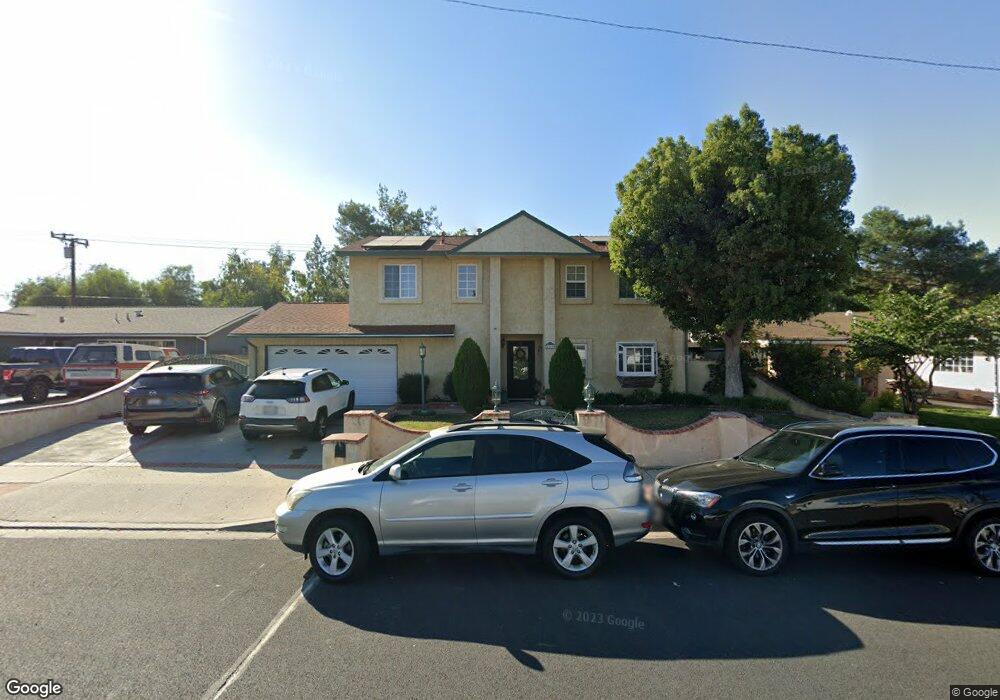
About This Home
This home is located at 2148 Morley St, Simi Valley, CA 93065 and is currently estimated at $814,081, approximately $471 per square foot. 2148 Morley St is a home located in Ventura County with nearby schools including Berylwood Elementary School, Hillside Middle School, and Royal High School.
Ownership History
We collect this data history from publicly available records. To have your information removed, we recommend requesting removal directly through your county’s website.
Purchase Details
Purchase Details
Home Values in the Area
Average Home Value in this Area
Purchase History
We collect this data history from publicly available records. To have your information removed, we recommend requesting removal directly through your county’s website.
| Date | Buyer | Sale Price | Title Company |
|---|---|---|---|
| -- | None Listed On Document | ||
| -- | Fidelity National Title |
Mortgage History
We collect this data history from publicly available records. To have your information removed, we recommend requesting removal directly through your county’s website.
| Date | Status | Borrower | Loan Amount |
|---|---|---|---|
| Previous Owner | $319,500 | ||
| Previous Owner | $345,000 | ||
| Previous Owner | $292,100 | ||
| Previous Owner | $300,000 | ||
| Previous Owner | $285,000 | ||
| Previous Owner | $250,000 | ||
| Previous Owner | $173,500 | ||
| Previous Owner | $75,000 | ||
| Previous Owner | $175,000 | ||
| Previous Owner | $50,000 | ||
| Previous Owner | $25,000 |
Tax History
We collect this data history from publicly available records. To have your information removed, we recommend requesting removal directly through your county’s website.
| Year | Tax Paid | Tax Assessment Tax Assessment Total Assessment is a certain percentage of the fair market value that is determined by local assessors to be the total taxable value of land and additions on the property. | Land | Improvement |
|---|---|---|---|---|
| 2025 | $3,063 | $219,557 | $76,839 | $142,718 |
| 2024 | $3,063 | $215,252 | $75,332 | $139,920 |
| 2023 | $2,876 | $211,032 | $73,855 | $137,177 |
| 2022 | $2,838 | $206,895 | $72,407 | $134,488 |
| 2021 | $2,794 | $202,839 | $70,988 | $131,851 |
| 2020 | $2,720 | $200,761 | $70,261 | $130,500 |
| 2019 | $2,591 | $196,826 | $68,884 | $127,942 |
| 2018 | $2,553 | $192,968 | $67,534 | $125,434 |
| 2017 | $2,484 | $189,185 | $66,210 | $122,975 |
| 2016 | $2,366 | $185,476 | $64,912 | $120,564 |
| 2015 | $2,304 | $182,692 | $63,938 | $118,754 |
| 2014 | $2,256 | $179,116 | $62,687 | $116,429 |
Map
- 2094 Elizondo Ave
- 2053 Malcolm St
- 2002 Malcolm St
- 2025 Royal Ave
- 1948 Heywood St Unit L
- 1904 Heywood St Unit L
- 1232 Whitcomb Ave
- 1932 Heywood St Unit B
- 2092 Cutler St
- 2031 Morning Glory St
- 1535 Gene Ave
- 1165 Brandon Ave
- 2118 Rosecrans St
- 2345 Bryson Place
- 1755 Heywood St Unit 106
- 1755 Heywood St Unit 203
- 1740 Patricia Ave
- 1618 Heywood St Unit E
- 1016 Roldan Ave
- 995 Vallejo Ave
- 2124 Morley St
- 2116 Morley St
- 2136 Morley St
- 2104 Morley St
- 2137 Morley St
- 2125 Morley St
- 2149 Morley St
- 2098 Morley St
- 2160 Morley St
- 2117 Morley St
- 2105 Morley St
- 2142 Malcolm St
- 2124 Malcolm St
- 2090 Morley St
- 2158 Malcolm St
- 2172 Morley St
- 2173 Morley St
- 2108 Malcolm St
- 2095 Morley St
- 2094 Malcolm St
Ask me questions while you tour the home.