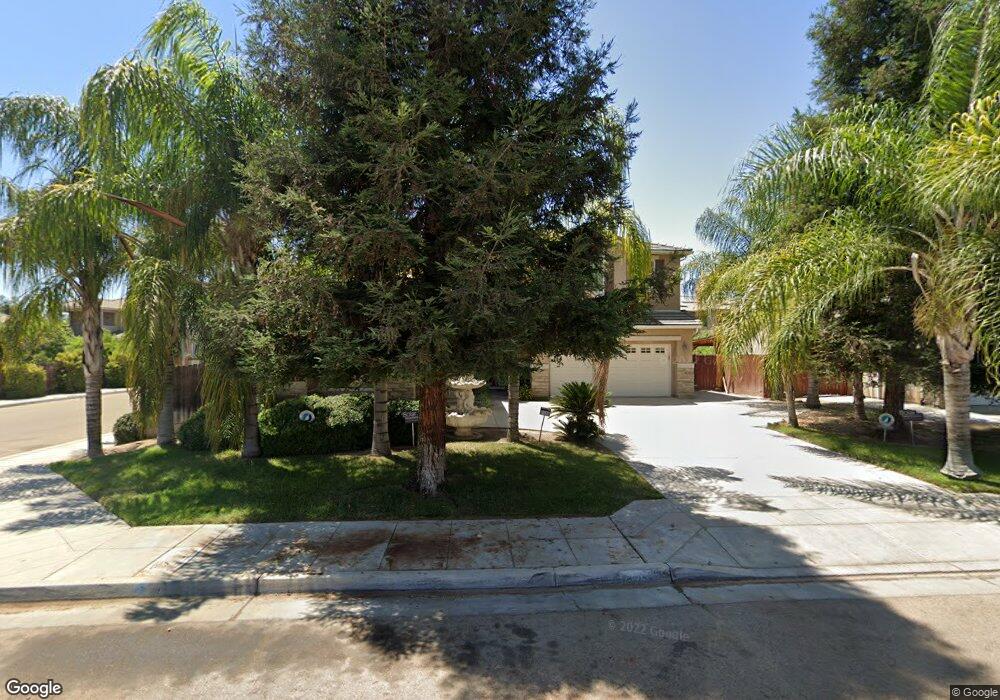
2148 S Purdue Ave Fresno, CA 93727
Sunnyside NeighborhoodEstimated Value: $525,672 - $608,000
5
Beds
3
Baths
3,060
Sq Ft
$185/Sq Ft
Est. Value
About This Home
This home is located at 2148 S Purdue Ave, Fresno, CA 93727 and is currently estimated at $567,418, approximately $185 per square foot. 2148 S Purdue Ave is a home located in Fresno County with nearby schools including Sequoia Elementary School, Washington Academic Middle School, and Sanger High School.
Ownership History
Date
Name
Owned For
Owner Type
Purchase Details
Closed on
Aug 21, 2023
Sold by
Christopher Moran 2013 Revocable Trust and Moran Christopher
Bought by
Moran Christopher L
Current Estimated Value
Home Financials for this Owner
Home Financials are based on the most recent Mortgage that was taken out on this home.
Original Mortgage
$412,500
Outstanding Balance
$403,360
Interest Rate
6.96%
Mortgage Type
New Conventional
Estimated Equity
$164,058
Purchase Details
Closed on
Aug 16, 2023
Sold by
Moran Christopher L
Bought by
Christopher Moran 2013 Revocable Trust and Moran
Home Financials for this Owner
Home Financials are based on the most recent Mortgage that was taken out on this home.
Original Mortgage
$412,500
Outstanding Balance
$403,360
Interest Rate
6.96%
Mortgage Type
New Conventional
Estimated Equity
$164,058
Purchase Details
Closed on
Aug 15, 2013
Sold by
Moran Christopher and Moran Christopher L
Bought by
Moran Christopher and Christopher Moran 2013 Revocable Trust
Purchase Details
Closed on
Mar 18, 2011
Sold by
Moran Christopher Lawrence and Moran Christopher L
Bought by
Moran Christopher Lawrence
Home Financials for this Owner
Home Financials are based on the most recent Mortgage that was taken out on this home.
Original Mortgage
$213,600
Interest Rate
5.02%
Mortgage Type
New Conventional
Purchase Details
Closed on
Dec 11, 2009
Sold by
Moran Mandy K
Bought by
Moran Christopher L
Home Financials for this Owner
Home Financials are based on the most recent Mortgage that was taken out on this home.
Original Mortgage
$189,562
Interest Rate
4.88%
Mortgage Type
New Conventional
Purchase Details
Closed on
Dec 1, 2009
Sold by
Aurora Loan Services Llc
Bought by
Moran Christopher L
Home Financials for this Owner
Home Financials are based on the most recent Mortgage that was taken out on this home.
Original Mortgage
$189,562
Interest Rate
4.88%
Mortgage Type
New Conventional
Purchase Details
Closed on
Sep 23, 2009
Sold by
Lee Kao and Lee Sheng Vang
Bought by
Aurora Loan Services Llc
Purchase Details
Closed on
Jul 13, 2004
Sold by
Granville Homes Inc
Bought by
Lee Kao and Lee Sheng Vang
Home Financials for this Owner
Home Financials are based on the most recent Mortgage that was taken out on this home.
Original Mortgage
$299,771
Interest Rate
5.62%
Mortgage Type
Purchase Money Mortgage
Create a Home Valuation Report for This Property
The Home Valuation Report is an in-depth analysis detailing your home's value as well as a comparison with similar homes in the area
Home Values in the Area
Average Home Value in this Area
Purchase History
| Date | Buyer | Sale Price | Title Company |
|---|---|---|---|
| Moran Christopher L | -- | Fidelity National Title | |
| Christopher Moran 2013 Revocable Trust | -- | Fidelity National Title | |
| Moran Christopher L | -- | Fidelity National Title Compan | |
| Moran Christopher L | -- | Fidelity National Title | |
| Moran Christopher | -- | None Available | |
| Moran Christopher Lawrence | -- | Placer Title Company | |
| Moran Christopher L | -- | Chicago Title Company | |
| Moran Christopher L | $253,000 | Chicago Title Company | |
| Aurora Loan Services Llc | $317,229 | Accommodation | |
| Lee Kao | $375,000 | Financial Title Company |
Source: Public Records
Mortgage History
| Date | Status | Borrower | Loan Amount |
|---|---|---|---|
| Open | Moran Christopher L | $412,500 | |
| Closed | Moran Christopher L | $412,500 | |
| Previous Owner | Moran Christopher Lawrence | $213,600 | |
| Previous Owner | Moran Christopher L | $189,562 | |
| Previous Owner | Moran Christopher L | $189,562 | |
| Previous Owner | Lee Kao | $299,771 | |
| Closed | Lee Kao | $56,207 |
Source: Public Records
Tax History Compared to Growth
Tax History
| Year | Tax Paid | Tax Assessment Tax Assessment Total Assessment is a certain percentage of the fair market value that is determined by local assessors to be the total taxable value of land and additions on the property. | Land | Improvement |
|---|---|---|---|---|
| 2025 | $4,281 | $325,274 | $77,442 | $247,832 |
| 2023 | $4,210 | $312,645 | $74,436 | $238,209 |
| 2022 | $4,141 | $306,516 | $72,977 | $233,539 |
| 2021 | $4,097 | $300,507 | $71,547 | $228,960 |
| 2020 | $3,954 | $297,427 | $70,814 | $226,613 |
| 2019 | $3,872 | $291,596 | $69,426 | $222,170 |
| 2018 | $3,695 | $285,879 | $68,065 | $217,814 |
| 2017 | $3,567 | $280,275 | $66,731 | $213,544 |
| 2016 | $3,379 | $274,780 | $65,423 | $209,357 |
| 2015 | $3,494 | $270,654 | $64,441 | $206,213 |
| 2014 | $3,530 | $265,353 | $63,179 | $202,174 |
Source: Public Records
Map
Nearby Homes
- 5875 E Pitt Ave
- 2163 S Bundy Dr
- 1904 S Fairway Ave
- 5976 E Butler Ave
- 5709 E Laurite Ave
- 6164 E Church Ave
- 6288 E Woodward Ave
- 810 S Cypress Ave
- 5646 E Park Circle Dr
- 5576 E Burns Ave
- 5481 E Geary St
- 6057 E Lane Ave
- 6259 E Liberty Ave
- 931 S Stanford Ave
- 945 S Clovis Ave Unit H
- 945 S Clovis Ave Unit G
- 945 S Clovis Ave Unit V
- 5433 E Geary St
- 6186 E Lane Ave
- 5478 E Butler Ave
- 2142 S Purdue Ave
- 2145 S Miami Ave
- 2240 S Purdue Ave
- 2137 S Miami Ave
- 5852 E Atchison St
- 2249 S Miami Ave
- 5847 E Atchison St
- 5851 E Lorena Ave
- 2250 S Purdue Ave
- 5856 E Atchison St
- 5851 E Atchison St
- 5841 E Atchison St
- 2257 S Miami Ave
- 5857 E Lorena Ave
- 2260 S Purdue Ave
- 5857 E Atchison St
- 5864 E Atchison St
- 5892 E Atchison St
- 2269 S Miami Ave
- 5863 E Lorena Ave