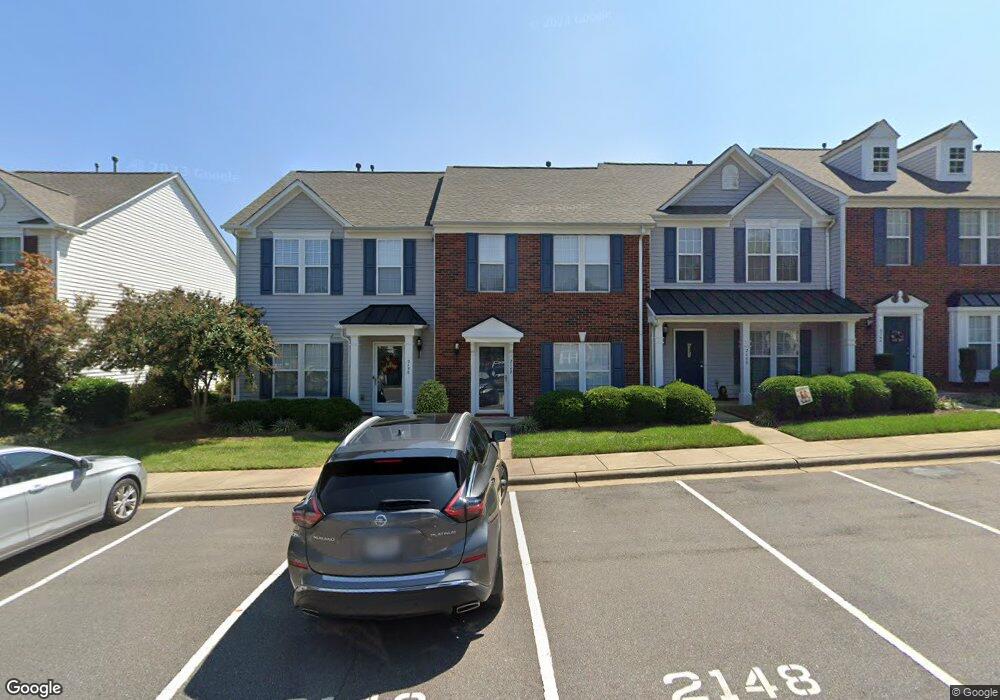
2148 Sail Pointe Ct Denver, NC 28037
Estimated Value: $246,000 - $325,000
2
Beds
3
Baths
1,538
Sq Ft
$178/Sq Ft
Est. Value
About This Home
This home is located at 2148 Sail Pointe Ct, Denver, NC 28037 and is currently estimated at $273,128, approximately $177 per square foot. 2148 Sail Pointe Ct is a home located in Lincoln County with nearby schools including St. James Elementary School, East Lincoln Middle School, and East Lincoln High School.
Ownership History
Date
Name
Owned For
Owner Type
Purchase Details
Closed on
Jul 8, 2019
Sold by
Leubner Horst
Bought by
Leubner Horst Gunter and Leubner Trust
Current Estimated Value
Purchase Details
Closed on
Jun 12, 2013
Sold by
Huffstetler Peggy Parker
Bought by
Leubner Horst and Leubner Anneliese
Purchase Details
Closed on
Jun 14, 2007
Sold by
Gregg Anna Richardson and Richardson Anna M
Bought by
Huffstetler Peggy Parker
Home Financials for this Owner
Home Financials are based on the most recent Mortgage that was taken out on this home.
Original Mortgage
$107,200
Interest Rate
6.12%
Mortgage Type
New Conventional
Purchase Details
Closed on
Mar 23, 2005
Sold by
Nvr Inc
Bought by
Richardson Anna M and Gregg Scott
Home Financials for this Owner
Home Financials are based on the most recent Mortgage that was taken out on this home.
Original Mortgage
$111,529
Interest Rate
5.54%
Mortgage Type
FHA
Purchase Details
Closed on
Mar 31, 2004
Bought by
Burke & Associates Llc
Create a Home Valuation Report for This Property
The Home Valuation Report is an in-depth analysis detailing your home's value as well as a comparison with similar homes in the area
Purchase History
| Date | Buyer | Sale Price | Title Company |
|---|---|---|---|
| Leubner Horst Gunter | -- | None Available | |
| Leubner Horst | $121,000 | None Available | |
| Huffstetler Peggy Parker | $134,000 | None Available | |
| Richardson Anna M | $113,500 | None Available | |
| Burke & Associates Llc | $750,000 | -- |
Source: Public Records
Mortgage History
| Date | Status | Borrower | Loan Amount |
|---|---|---|---|
| Previous Owner | Huffstetler Peggy Parker | $107,200 | |
| Previous Owner | Richardson Anna M | $111,529 |
Source: Public Records
Tax History
| Year | Tax Paid | Tax Assessment Tax Assessment Total Assessment is a certain percentage of the fair market value that is determined by local assessors to be the total taxable value of land and additions on the property. | Land | Improvement |
|---|---|---|---|---|
| 2025 | $1,749 | $266,331 | $37,000 | $229,331 |
| 2024 | $1,722 | $266,331 | $37,000 | $229,331 |
| 2023 | $1,717 | $266,331 | $37,000 | $229,331 |
| 2022 | $1,288 | $158,727 | $30,000 | $128,727 |
| 2021 | $1,296 | $158,727 | $30,000 | $128,727 |
| 2020 | $1,106 | $158,727 | $30,000 | $128,727 |
| 2019 | $1,106 | $158,727 | $30,000 | $128,727 |
| 2018 | $971 | $124,264 | $23,500 | $100,764 |
| 2017 | $870 | $124,264 | $23,500 | $100,764 |
| 2016 | $866 | $124,264 | $23,500 | $100,764 |
| 2015 | $973 | $124,264 | $23,500 | $100,764 |
| 2014 | $911 | $120,764 | $20,000 | $100,764 |
Source: Public Records
Map
Nearby Homes
- 7948 Mariners Pointe Cir
- 7892 Mariners Pointe Cir
- 2440 Mariners Cove Ln
- 2833 Sand Cove Ct
- 7903 Smith Pond Dr
- 7958 Unity Church Rd
- 2344 Smith Cove Rd
- 2378 Smith Harbour Dr
- 7380 Latham Way
- 7200 Indigo Way
- 2028 Rock Springs Cir
- 1842 Rock Springs Cir
- 2550 Green Point Ln
- 2325 Perry Rd
- 6859 Lakecrest Ct
- 2514 Smith Harbour Dr
- 1751 Knights Dr
- 2456 W Nicole Ln
- 7208 Ogden Place
- 7217 Kenyon Dr
- 2148 Sail Pointe Ln Unit 70
- 2148 Sail Pointe Ln
- 2148 Sail Pointe Ct Unit 14B
- 2150 Sail Pointe Ct
- 2150 Sail Pointe Ct Unit 14A
- 2150 Sail Pointe Ct Unit 69
- 2146 Sail Pointe Ln
- 2146 Sail Pointe Ct
- 2144 Sail Pointe Ln
- 2144 Sail Pointe Ct
- 2144 Sail Pointe Ln Unit 72
- 7929 Mariners Pointe Cir
- 2152 Sail Pointe Ct
- 2142 Sail Pointe Ln
- 2142 Sail Pointe Ct
- 7937 Mariners Pointe Cir Unit 77
- 7935 Mariners Pointe Cir
- 2154 Sail Pointe Ct
- 7941 Mariners Pointe Cir
- 7000 Sail Pointe Ln Unit D
Your Personal Tour Guide
Ask me questions while you tour the home.