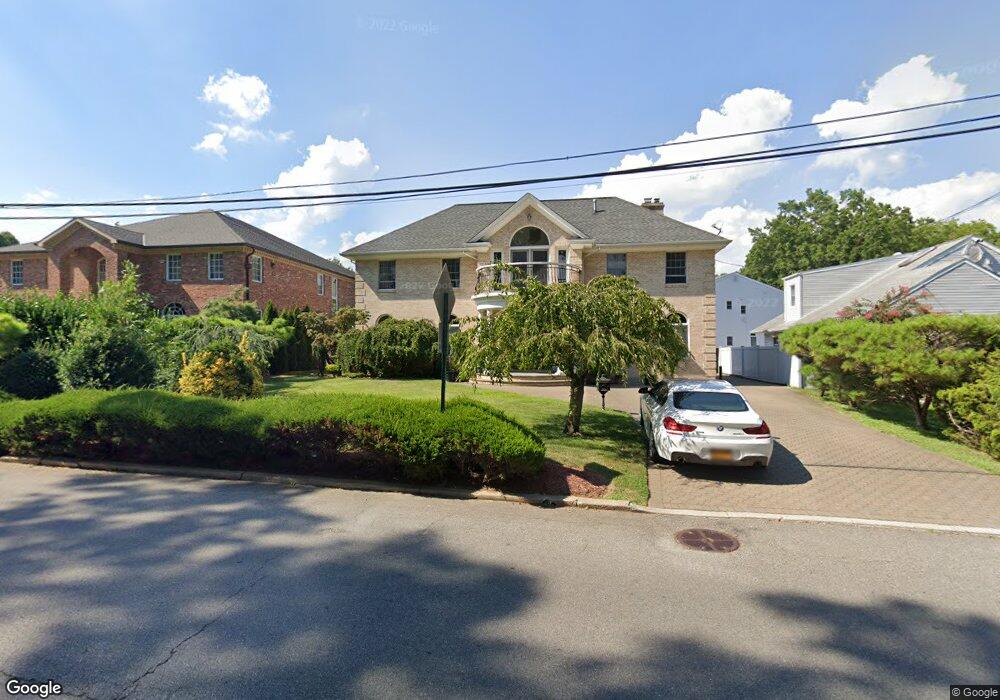
21485 33rd Rd Bayside, NY 11361
Bayside NeighborhoodEstimated Value: $1,736,000 - $2,189,000
Studio
--
Bath
3,552
Sq Ft
$535/Sq Ft
Est. Value
About This Home
This home is located at 21485 33rd Rd, Bayside, NY 11361 and is currently estimated at $1,901,473, approximately $535 per square foot. 21485 33rd Rd is a home located in Queens County with nearby schools including P.S. 41 - Crocheron, M.S. 158 - Marie Curie, and Bayside High School.
Ownership History
Date
Name
Owned For
Owner Type
Purchase Details
Closed on
Mar 20, 2003
Sold by
Tsui Guang Dah
Bought by
Wan Perina O and Wan Vince C
Current Estimated Value
Purchase Details
Closed on
Nov 12, 2000
Sold by
Minori Sergio and Minori Joann
Bought by
Tsui Guang Dah
Home Financials for this Owner
Home Financials are based on the most recent Mortgage that was taken out on this home.
Original Mortgage
$350,000
Interest Rate
7.52%
Purchase Details
Closed on
Sep 28, 2000
Sold by
Minori Jo Ann
Bought by
Minori Sergio and Minori Jo Ann
Home Financials for this Owner
Home Financials are based on the most recent Mortgage that was taken out on this home.
Original Mortgage
$350,000
Interest Rate
7.52%
Purchase Details
Closed on
May 12, 2000
Sold by
Minori Sergio and Minori Jo Ann
Bought by
Minori Jo Ann
Create a Home Valuation Report for This Property
The Home Valuation Report is an in-depth analysis detailing your home's value as well as a comparison with similar homes in the area
Home Values in the Area
Average Home Value in this Area
Purchase History
| Date | Buyer | Sale Price | Title Company |
|---|---|---|---|
| Wan Perina O | $780,000 | -- | |
| Wan Perina O | $780,000 | -- | |
| Tsui Guang Dah | $550,000 | -- | |
| Tsui Guang Dah | $550,000 | -- | |
| Minori Sergio | -- | Chicago Title | |
| Minori Sergio | -- | Chicago Title | |
| Minori Jo Ann | -- | Fidelity National Title | |
| Minori Jo Ann | -- | Fidelity National Title |
Source: Public Records
Mortgage History
| Date | Status | Borrower | Loan Amount |
|---|---|---|---|
| Previous Owner | Tsui Guang Dah | $350,000 | |
| Closed | Wan Perina O | $0 |
Source: Public Records
Tax History
| Year | Tax Paid | Tax Assessment Tax Assessment Total Assessment is a certain percentage of the fair market value that is determined by local assessors to be the total taxable value of land and additions on the property. | Land | Improvement |
|---|---|---|---|---|
| 2025 | $13,857 | $77,162 | $9,978 | $67,184 |
| 2024 | $13,962 | $72,794 | $8,896 | $63,898 |
| 2023 | $13,030 | $68,674 | $9,311 | $59,363 |
| 2022 | $15,810 | $105,060 | $17,100 | $87,960 |
| 2021 | $19,891 | $111,180 | $17,100 | $94,080 |
| 2020 | $18,840 | $122,220 | $17,100 | $105,120 |
| 2019 | $17,669 | $104,640 | $17,100 | $87,540 |
| 2018 | $16,190 | $82,656 | $11,897 | $70,759 |
| 2017 | $16,535 | $82,584 | $10,503 | $72,081 |
| 2016 | $15,957 | $82,584 | $10,503 | $72,081 |
| 2015 | $9,177 | $76,767 | $17,041 | $59,726 |
| 2014 | $9,177 | $73,012 | $17,574 | $55,438 |
Source: Public Records
Map
Nearby Homes
- 32-37 214th St
- 33-03 213th St
- 217-32 Corbett Rd
- 29-41 218th St
- 217-63 Corbett Rd
- 29-30 Bell Blvd
- 2930 Bell Blvd
- 36-26 217th St
- 2914 Bell Blvd
- 21820 36th Ave
- 2901 Bell Blvd
- 35-22 221st St
- 211-22 34th Rd
- 38-36 215th St
- 38-24 215th St
- 38-28 215th St
- 38-32 215th St
- 2835 Bell Blvd
- 38-30 215th Place
- 3832 215th Place
- 3324 215th Place
- 21477 33rd Rd
- 3304 215th Place
- 21510 33rd Ave
- 21510 33rd Ave
- 21467 33rd Rd
- 21504 33rd Ave
- 21472 33rd Ave
- 21457 33rd Rd
- 21462 33rd Ave
- 21456 33rd Ave
- 21481 33rd Ave
- 21487 33rd Ave
- 214-33 33rd Rd
- 21469 33rd Ave
- 21450 33rd Ave
- 21433 33rd Rd
- 21465 33rd Ave
- 21457 33rd Ave
- 214-33 214 Place
Your Personal Tour Guide
Ask me questions while you tour the home.