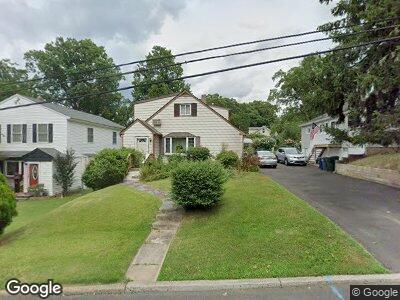
2149 Clearview Ave Abington, PA 19001
Abington NeighborhoodEstimated Value: $377,000 - $412,115
5
Beds
3
Baths
1,855
Sq Ft
$211/Sq Ft
Est. Value
About This Home
This home is located at 2149 Clearview Ave, Abington, PA 19001 and is currently estimated at $392,029, approximately $211 per square foot. 2149 Clearview Ave is a home located in Montgomery County with nearby schools including Highland School, Abington Middle School, and Abington Senior High School.
Ownership History
Date
Name
Owned For
Owner Type
Purchase Details
Closed on
Apr 30, 2021
Sold by
Sellers Richard K
Bought by
Sellers Roy J
Current Estimated Value
Home Financials for this Owner
Home Financials are based on the most recent Mortgage that was taken out on this home.
Original Mortgage
$220,000
Interest Rate
2.9%
Mortgage Type
New Conventional
Purchase Details
Closed on
Oct 20, 2010
Sold by
Sellers Celeste and Sellers Ricahrd K
Bought by
Sellers Richard K
Home Financials for this Owner
Home Financials are based on the most recent Mortgage that was taken out on this home.
Original Mortgage
$116,000
Interest Rate
4.35%
Purchase Details
Closed on
Apr 29, 1996
Sold by
Dephillips August S and Dephillips Sharon L
Bought by
Sellers Richard K and Sellers Celeste
Create a Home Valuation Report for This Property
The Home Valuation Report is an in-depth analysis detailing your home's value as well as a comparison with similar homes in the area
Home Values in the Area
Average Home Value in this Area
Purchase History
| Date | Buyer | Sale Price | Title Company |
|---|---|---|---|
| Sellers Roy J | $275,000 | None Available | |
| Sellers Richard K | -- | None Available | |
| Sellers Richard K | $118,000 | -- |
Source: Public Records
Mortgage History
| Date | Status | Borrower | Loan Amount |
|---|---|---|---|
| Open | Sellers Roy J | $17,500 | |
| Previous Owner | Sellers Roy J | $220,000 | |
| Previous Owner | Sellers Richard K | $148,000 | |
| Previous Owner | Sellers Richard K | $15,000 | |
| Previous Owner | Sellers Richard K | $116,000 | |
| Previous Owner | Sellers Richard K | $32,000 |
Source: Public Records
Tax History Compared to Growth
Tax History
| Year | Tax Paid | Tax Assessment Tax Assessment Total Assessment is a certain percentage of the fair market value that is determined by local assessors to be the total taxable value of land and additions on the property. | Land | Improvement |
|---|---|---|---|---|
| 2024 | $5,332 | $115,150 | $39,570 | $75,580 |
| 2023 | $5,111 | $115,150 | $39,570 | $75,580 |
| 2022 | $4,946 | $115,150 | $39,570 | $75,580 |
| 2021 | $4,680 | $115,150 | $39,570 | $75,580 |
| 2020 | $4,613 | $115,150 | $39,570 | $75,580 |
| 2019 | $4,613 | $115,150 | $39,570 | $75,580 |
| 2018 | $4,613 | $115,150 | $39,570 | $75,580 |
| 2017 | $4,477 | $115,150 | $39,570 | $75,580 |
| 2016 | $4,432 | $115,150 | $39,570 | $75,580 |
| 2015 | $4,166 | $115,150 | $39,570 | $75,580 |
| 2014 | $4,166 | $115,150 | $39,570 | $75,580 |
Source: Public Records
Map
Nearby Homes
- 2154 Clearview Ave
- 1504 Grovania Ave
- 2242 Clearview Ave
- 1566 Rockwell Rd
- 2085 Keith Rd
- 1551 Prospect Ave
- 1431 Wheatsheaf Ln
- 1569 Prospect Ave
- 2112 Woodland Rd
- 1625 Washington Ave
- 0 Franklin Ave Unit PAMC2112668
- 2020 Butler Ave
- 2338 Hamilton Ave
- 1632 Edge Hill Rd
- 1664 Old York Rd
- 1413 High Ave
- 0 Fairview Ave
- 2343 Rubicam Ave
- 1578 Marian Rd
- 1123 Cumberland Rd
- 2149 Clearview Ave
- 2153 Clearview Ave
- 2145 Clearview Ave
- 2157 Clearview Ave
- 2141 Clearview Ave
- 2150 Glendale Ave
- 2144 Glendale Ave
- 2137 Clearview Ave
- 2156 Glendale Ave
- 2140 Glendale Ave
- 2146 Clearview Ave
- 2150 Clearview Ave
- 1447 Grovania Ave
- 2142 Clearview Ave
- 1443 Grovania Ave
- 2136 Glendale Ave
- 1451 Grovania Ave
- 2133 Clearview Ave
- 2138 Clearview Ave Unit 62
- 2158 Clearview Ave