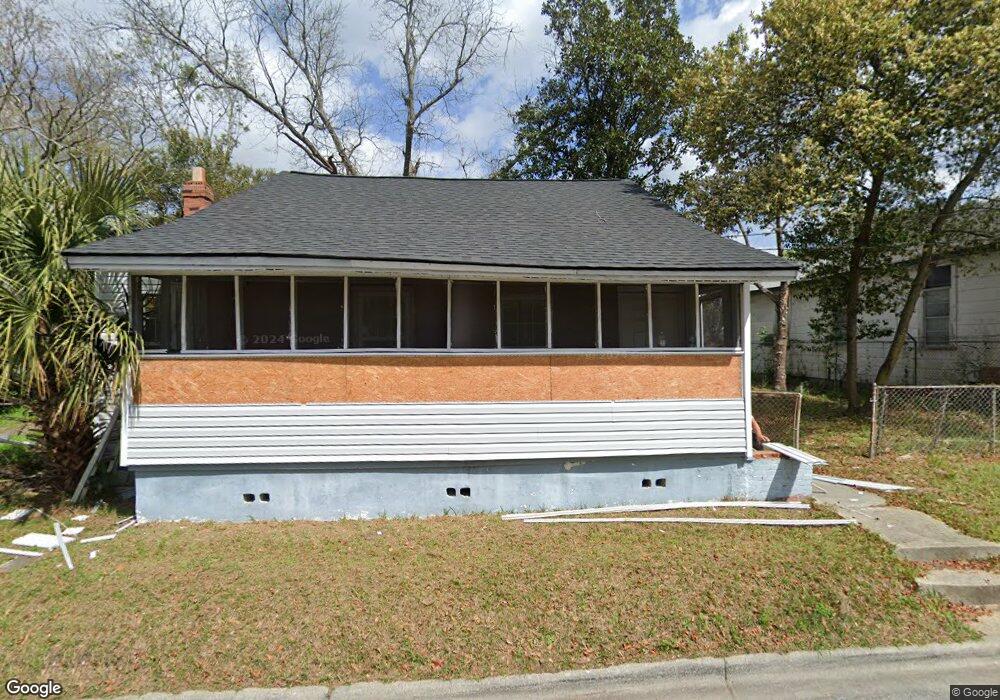
2149 Hudson St Savannah, GA 31415
West Savannah NeighborhoodEstimated Value: $81,000 - $134,117
2
Beds
1
Bath
1,080
Sq Ft
$107/Sq Ft
Est. Value
About This Home
This home is located at 2149 Hudson St, Savannah, GA 31415 and is currently estimated at $115,279, approximately $106 per square foot. 2149 Hudson St is a home located in Chatham County with nearby schools including Otis J. Brock, III Elementary School, Mercer Middle School, and Groves High School.
Ownership History
Date
Name
Owned For
Owner Type
Purchase Details
Closed on
Nov 3, 2021
Sold by
Southern Tide Properties 3 Llc
Bought by
Cms Rental Properties Llc
Current Estimated Value
Purchase Details
Closed on
Sep 18, 2020
Sold by
2149 Hudson Llc
Bought by
Southern Tide Properties 3 Llc
Purchase Details
Closed on
May 27, 2020
Sold by
Owens Lamar
Bought by
2149 Hudson Llc
Purchase Details
Closed on
Dec 19, 2019
Sold by
Walker John W
Bought by
Owens Lamar
Purchase Details
Closed on
Jun 15, 2006
Sold by
Not Provided
Bought by
Walker John W
Create a Home Valuation Report for This Property
The Home Valuation Report is an in-depth analysis detailing your home's value as well as a comparison with similar homes in the area
Home Values in the Area
Average Home Value in this Area
Purchase History
| Date | Buyer | Sale Price | Title Company |
|---|---|---|---|
| Cms Rental Properties Llc | -- | -- | |
| Southern Tide Properties 3 Llc | $40,000 | -- | |
| 2149 Hudson Llc | -- | -- | |
| Owens Lamar | $28,000 | -- | |
| Walker John W | $8,000 | -- |
Source: Public Records
Tax History Compared to Growth
Tax History
| Year | Tax Paid | Tax Assessment Tax Assessment Total Assessment is a certain percentage of the fair market value that is determined by local assessors to be the total taxable value of land and additions on the property. | Land | Improvement |
|---|---|---|---|---|
| 2025 | $1,385 | $43,000 | $24,800 | $18,200 |
| 2024 | $1,385 | $23,840 | $8,000 | $15,840 |
| 2023 | $224 | $18,320 | $3,400 | $14,920 |
| 2022 | $206 | $16,920 | $3,400 | $13,520 |
| 2021 | $800 | $13,560 | $3,400 | $10,160 |
| 2020 | $395 | $11,200 | $3,040 | $8,160 |
| 2019 | $755 | $12,520 | $3,400 | $9,120 |
| 2018 | $1,604 | $12,600 | $3,400 | $9,200 |
| 2017 | $1,368 | $12,840 | $3,400 | $9,440 |
| 2016 | $383 | $13,120 | $3,400 | $9,720 |
| 2015 | $1,507 | $13,760 | $3,480 | $10,280 |
| 2014 | $860 | $15,440 | $0 | $0 |
Source: Public Records
Map
Nearby Homes