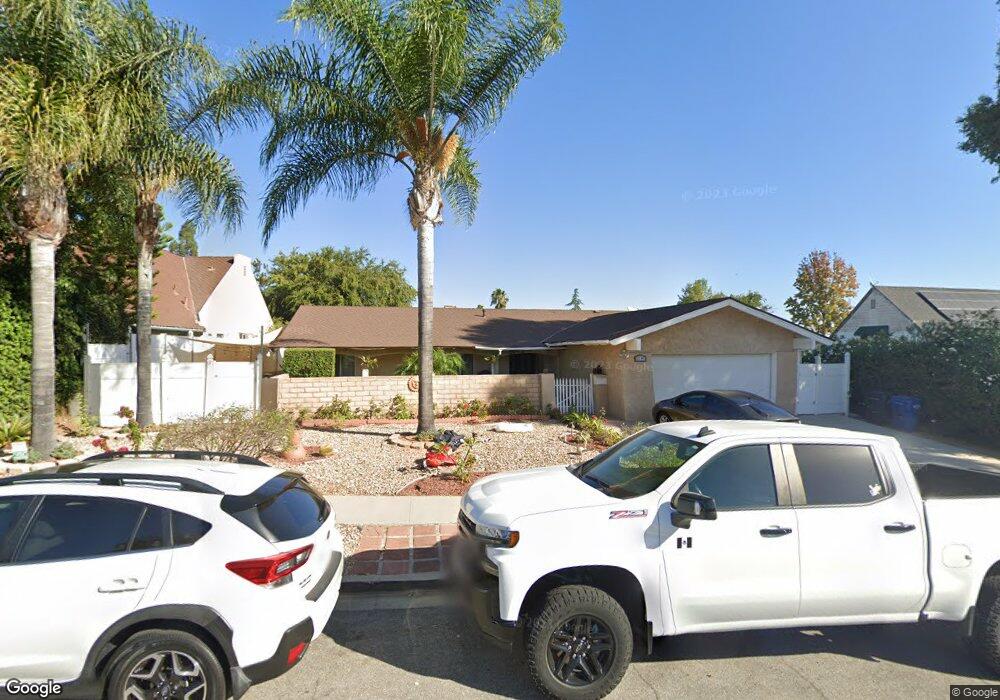
2149 Palos Ct Newbury Park, CA 91320
Estimated Value: $1,013,000 - $1,074,000
4
Beds
2
Baths
1,953
Sq Ft
$529/Sq Ft
Est. Value
About This Home
This home is located at 2149 Palos Ct, Newbury Park, CA 91320 and is currently estimated at $1,032,531, approximately $528 per square foot. 2149 Palos Ct is a home located in Ventura County with nearby schools including Banyan Elementary School, Sequoia Middle School, and Newbury Park High School.
Ownership History
Date
Name
Owned For
Owner Type
Purchase Details
Closed on
Apr 24, 2019
Sold by
Perez Clara
Bought by
Perez Clara and Kumar Manoj
Current Estimated Value
Home Financials for this Owner
Home Financials are based on the most recent Mortgage that was taken out on this home.
Original Mortgage
$438,000
Outstanding Balance
$385,080
Interest Rate
4.3%
Mortgage Type
New Conventional
Estimated Equity
$647,451
Purchase Details
Closed on
May 10, 2006
Sold by
Perez Clara and De Santiago Clara
Bought by
Perez Clara
Home Financials for this Owner
Home Financials are based on the most recent Mortgage that was taken out on this home.
Original Mortgage
$500,000
Interest Rate
6.5%
Mortgage Type
Purchase Money Mortgage
Purchase Details
Closed on
Nov 5, 2003
Sold by
Piggin David M
Bought by
Desantiago Clara
Home Financials for this Owner
Home Financials are based on the most recent Mortgage that was taken out on this home.
Original Mortgage
$396,160
Interest Rate
7.25%
Mortgage Type
Purchase Money Mortgage
Purchase Details
Closed on
Oct 8, 1999
Sold by
Piggin David M
Bought by
Piggin David M
Create a Home Valuation Report for This Property
The Home Valuation Report is an in-depth analysis detailing your home's value as well as a comparison with similar homes in the area
Home Values in the Area
Average Home Value in this Area
Purchase History
| Date | Buyer | Sale Price | Title Company |
|---|---|---|---|
| Perez Clara | $219,000 | Wfg National Title Co Of Ca | |
| Perez Clara | -- | First Southwestern Title Ca | |
| Desantiago Clara | $495,500 | Fidelity National Title Co | |
| Piggin David M | -- | -- |
Source: Public Records
Mortgage History
| Date | Status | Borrower | Loan Amount |
|---|---|---|---|
| Open | Perez Clara | $438,000 | |
| Previous Owner | Perez Clara | $500,000 | |
| Previous Owner | Desantiago Clara | $396,160 | |
| Closed | Desantiago Clara | $99,040 |
Source: Public Records
Tax History Compared to Growth
Tax History
| Year | Tax Paid | Tax Assessment Tax Assessment Total Assessment is a certain percentage of the fair market value that is determined by local assessors to be the total taxable value of land and additions on the property. | Land | Improvement |
|---|---|---|---|---|
| 2025 | $7,829 | $715,507 | $352,027 | $363,480 |
| 2024 | $7,829 | $701,478 | $345,125 | $356,353 |
| 2023 | $7,601 | $687,724 | $338,358 | $349,366 |
| 2022 | $7,467 | $674,240 | $331,724 | $342,516 |
| 2021 | $7,340 | $661,020 | $325,220 | $335,800 |
| 2020 | $6,890 | $654,243 | $321,886 | $332,357 |
| 2019 | $6,707 | $641,416 | $315,575 | $325,841 |
| 2018 | $6,572 | $628,840 | $309,388 | $319,452 |
| 2017 | $6,444 | $616,511 | $303,322 | $313,189 |
| 2016 | $6,457 | $604,424 | $297,375 | $307,049 |
| 2015 | $6,345 | $595,347 | $292,909 | $302,438 |
| 2014 | $6,248 | $583,000 | $292,000 | $291,000 |
Source: Public Records
Map
Nearby Homes
- 251 Asta Ct
- 1930 Adrian St
- 5 S Beatty Place
- 190 Donegal Ave
- 2742 Borchard Rd Unit 207
- 2775 Edgeview Ct
- 1667 Calle Zafiro Unit 4
- 16 Robertson Way
- 187 Silas Ave
- 628 Paseo la Perla
- 184 Pepper Rd
- 122 Beech Rd
- 1 Ortega Dr
- 602 Avenida Del Platino
- 1325 Ashton Park Ln
- 155 Maple Rd
- 1689 Amador Ln
- 639 Avenida Del Platino
- 1315 Ramona Dr
- 560 Randy Dr