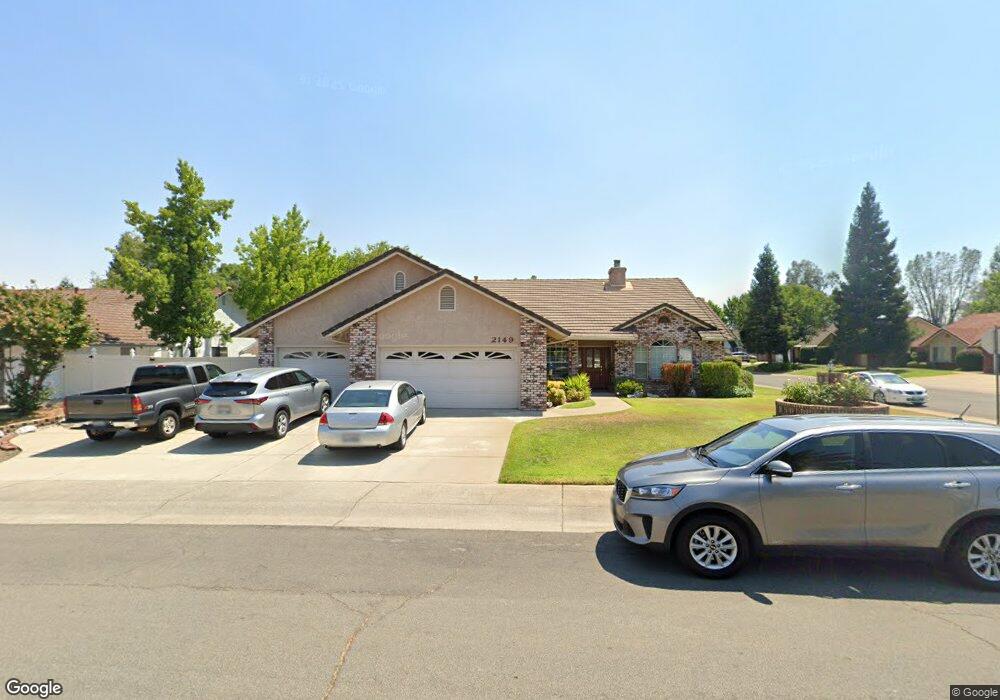
2149 Sageway Dr Redding, CA 96003
North Shasta View NeighborhoodEstimated Value: $443,000 - $509,172
4
Beds
2
Baths
2,212
Sq Ft
$218/Sq Ft
Est. Value
About This Home
This home is located at 2149 Sageway Dr, Redding, CA 96003 and is currently estimated at $483,293, approximately $218 per square foot. 2149 Sageway Dr is a home located in Shasta County with nearby schools including Columbia Elementary School, Mountain View Middle School, and Foothill High School.
Ownership History
Date
Name
Owned For
Owner Type
Purchase Details
Closed on
Apr 9, 2015
Sold by
Farley Willard E and Farley Shirley J
Bought by
Farley Shirley J
Current Estimated Value
Purchase Details
Closed on
Jun 20, 2006
Sold by
Farley Willard E and Farley Shirley J
Bought by
Farley Willard E and Farley Shirley J
Create a Home Valuation Report for This Property
The Home Valuation Report is an in-depth analysis detailing your home's value as well as a comparison with similar homes in the area
Home Values in the Area
Average Home Value in this Area
Purchase History
| Date | Buyer | Sale Price | Title Company |
|---|---|---|---|
| Farley Shirley J | -- | None Available | |
| Farley Willard E | -- | None Available |
Source: Public Records
Tax History
| Year | Tax Paid | Tax Assessment Tax Assessment Total Assessment is a certain percentage of the fair market value that is determined by local assessors to be the total taxable value of land and additions on the property. | Land | Improvement |
|---|---|---|---|---|
| 2025 | $3,457 | $341,246 | $54,090 | $287,156 |
| 2024 | $3,473 | $334,556 | $53,030 | $281,526 |
| 2023 | $3,473 | $327,997 | $51,991 | $276,006 |
| 2022 | $3,357 | $321,567 | $50,972 | $270,595 |
| 2021 | $3,332 | $315,263 | $49,973 | $265,290 |
| 2020 | $3,306 | $312,031 | $49,461 | $262,570 |
| 2019 | $3,228 | $305,914 | $48,492 | $257,422 |
| 2018 | $3,252 | $299,917 | $47,542 | $252,375 |
| 2017 | $3,293 | $294,037 | $46,610 | $247,427 |
| 2016 | $3,076 | $288,273 | $45,697 | $242,576 |
| 2015 | $3,027 | $283,944 | $45,011 | $238,933 |
| 2014 | $2,949 | $278,383 | $44,130 | $234,253 |
Source: Public Records
Map
Nearby Homes
- 1595 Sterling Dr
- 1865 Dellwood Dr
- 2093 Victor Ave
- 1939 Cameo Ct
- 2100 Deerfield Ave
- 1637 French Lace Ln
- 1090 Gibralter Rd
- 965 Willow Brook Ln
- 2935 Snow Fire Ct
- 1461 Oakdale Ln
- 1110 Grouse Dr
- 10033 Abernathy Ln
- 1701 E Cypress Ave
- 1750 Hawthorne Ct
- 1285 Lancers Ln
- 1877 Wheeler St
- 1088 Burton Dr
- 2728 Jasmine Way
- 2571 Erin Ln
- 1556 Minor St
- 2163 Sageway Dr
- 1715 Vinson Dr
- 2171 Sageway Dr Unit 2
- 2171 Sageway Dr
- 1700 Vinson Dr Unit 1
- 1700 Vinson Dr
- 1710 Vinson Dr
- 2150 Sageway Dr
- 1725 Vinson Dr
- 2142 Sageway Dr
- 2158 Sageway Dr Unit 1
- 2158 Sageway Dr
- 1720 Vinson Dr
- 1730 Oak Mesa Ln
- 2134 Sageway Dr
- 2166 Sageway Dr
- 2185 Sageway Dr
- 1735 Vinson Dr
- 1730 Vinson Dr
- 1760 Oak Mesa Ln
Your Personal Tour Guide
Ask me questions while you tour the home.