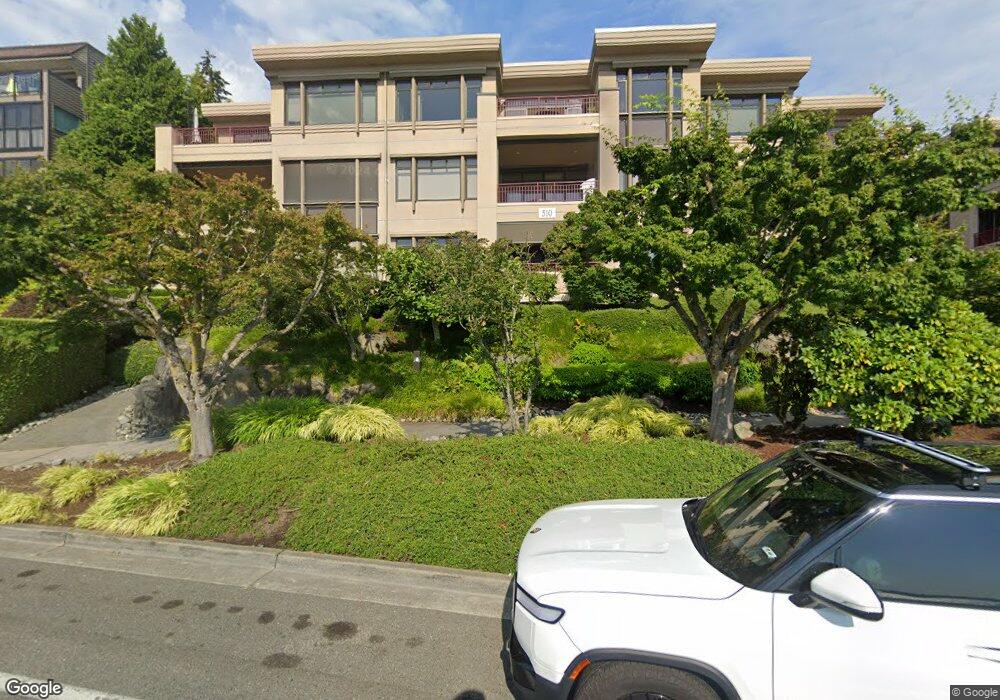
Shumway Condominiums 215 5th Ave S Unit A103 Kirkland, WA 98033
Moss Bay NeighborhoodEstimated Value: $2,556,000 - $2,788,000
3
Beds
4
Baths
2,633
Sq Ft
$1,014/Sq Ft
Est. Value
About This Home
This home is located at 215 5th Ave S Unit A103, Kirkland, WA 98033 and is currently estimated at $2,669,279, approximately $1,013 per square foot. 215 5th Ave S Unit A103 is a home located in King County with nearby schools including Lakeview Elementary School, Kirkland Middle School, and Lake Washington High School.
Ownership History
Date
Name
Owned For
Owner Type
Purchase Details
Closed on
May 26, 2016
Sold by
Marchand Robin A and Rice David A
Bought by
Sussman Kevin H and Sussman Lori
Current Estimated Value
Home Financials for this Owner
Home Financials are based on the most recent Mortgage that was taken out on this home.
Original Mortgage
$300,000
Outstanding Balance
$238,922
Interest Rate
3.59%
Estimated Equity
$2,430,357
Purchase Details
Closed on
Mar 31, 2016
Sold by
Marchand Robin and Rice David A
Bought by
Marchand Robin A and Rice David A
Home Financials for this Owner
Home Financials are based on the most recent Mortgage that was taken out on this home.
Original Mortgage
$300,000
Outstanding Balance
$238,922
Interest Rate
3.59%
Estimated Equity
$2,430,357
Purchase Details
Closed on
Dec 26, 2012
Sold by
Rice Richard H
Bought by
Marchund Robin A and Rice David A
Purchase Details
Closed on
Dec 18, 2012
Sold by
Rice Richard H and Rice Grace L
Bought by
Rice Richard H and Rice Grace I
Purchase Details
Closed on
Dec 16, 1997
Sold by
Shumway Inc
Bought by
Rice Richard H and Rice Grace I
Create a Home Valuation Report for This Property
The Home Valuation Report is an in-depth analysis detailing your home's value as well as a comparison with similar homes in the area
Home Values in the Area
Average Home Value in this Area
Purchase History
| Date | Buyer | Sale Price | Title Company |
|---|---|---|---|
| Sussman Kevin H | $1,560,000 | Cw Title Co | |
| Marchand Robin A | -- | None Available | |
| Marchand Robin A | -- | None Available | |
| Marchund Robin A | -- | None Available | |
| Marchand Robin A | -- | None Available | |
| Rice Richard H | -- | None Available | |
| Rice Richard H | $750,000 | Transnation Title Insurance |
Source: Public Records
Mortgage History
| Date | Status | Borrower | Loan Amount |
|---|---|---|---|
| Open | Sussman Kevin H | $300,000 |
Source: Public Records
Tax History Compared to Growth
Tax History
| Year | Tax Paid | Tax Assessment Tax Assessment Total Assessment is a certain percentage of the fair market value that is determined by local assessors to be the total taxable value of land and additions on the property. | Land | Improvement |
|---|---|---|---|---|
| 2024 | $18,814 | $2,347,000 | $607,900 | $1,739,100 |
| 2023 | $18,377 | $2,774,000 | $607,900 | $2,166,100 |
| 2022 | $17,584 | $2,463,000 | $455,900 | $2,007,100 |
| 2021 | $17,573 | $2,001,000 | $440,700 | $1,560,300 |
| 2020 | $19,142 | $1,840,000 | $440,700 | $1,399,300 |
| 2018 | $16,378 | $2,062,000 | $410,300 | $1,651,700 |
| 2017 | $13,180 | $1,638,000 | $395,100 | $1,242,900 |
| 2016 | $12,456 | $1,375,000 | $334,300 | $1,040,700 |
| 2015 | $11,903 | $1,283,000 | $319,100 | $963,900 |
| 2014 | -- | $1,181,000 | $319,100 | $861,900 |
| 2013 | -- | $1,071,000 | $319,100 | $751,900 |
Source: Public Records
About Shumway Condominiums
Map
Nearby Homes
- 205 4th Ct S Unit 13
- 213 4th Ct S
- 201 2nd St S Unit 103
- 201 2nd St S Unit 201
- 515 Lake St S Unit 109
- 335 4th Ave S
- 721 2nd St S
- 116 2nd St S
- 112 2nd St S
- 110 2nd St S
- 118 2nd St S
- 109 2nd St S Unit 423
- 122 State St S Unit 208E
- 818 Lake St S Unit 818
- 65 Kirkland Ave Unit 201
- 65 Kirkland Ave Unit 202
- 375 Kirkland Ave Unit 203
- 375 Kirkland Ave Unit 108
- 375 Kirkland Ave Unit 145
- 832 Lake St S
- 215 5th Ave S Unit PH301
- 215 5th Ave S Unit C204
- 215 5th Ave S Unit D301
- 215 5th Ave S Unit D101
- 215 5th Ave S Unit C102
- 215 5th Ave S Unit G104
- 215 5th Ave S Unit F104
- 215 5th Ave S Unit B201
- 215 5th Ave S Unit B101
- 215 5th Ave S Unit C301
- 215 5th Ave S Unit A203
- 215 5th Ave S Unit D201
- 215 5th Ave S Unit E202
- 215 5th Ave S Unit A202
- 215 5th Ave S Unit B301
- 215 5th Ave S Unit A201
- 215 5th Ave S Unit B202
- 215 5th Ave S Unit E302
- 215 5th Ave S Unit F302
- 215 5th Ave S Unit G102