Estimated Value: $342,497 - $376,000
4
Beds
3
Baths
2,350
Sq Ft
$153/Sq Ft
Est. Value
About This Home
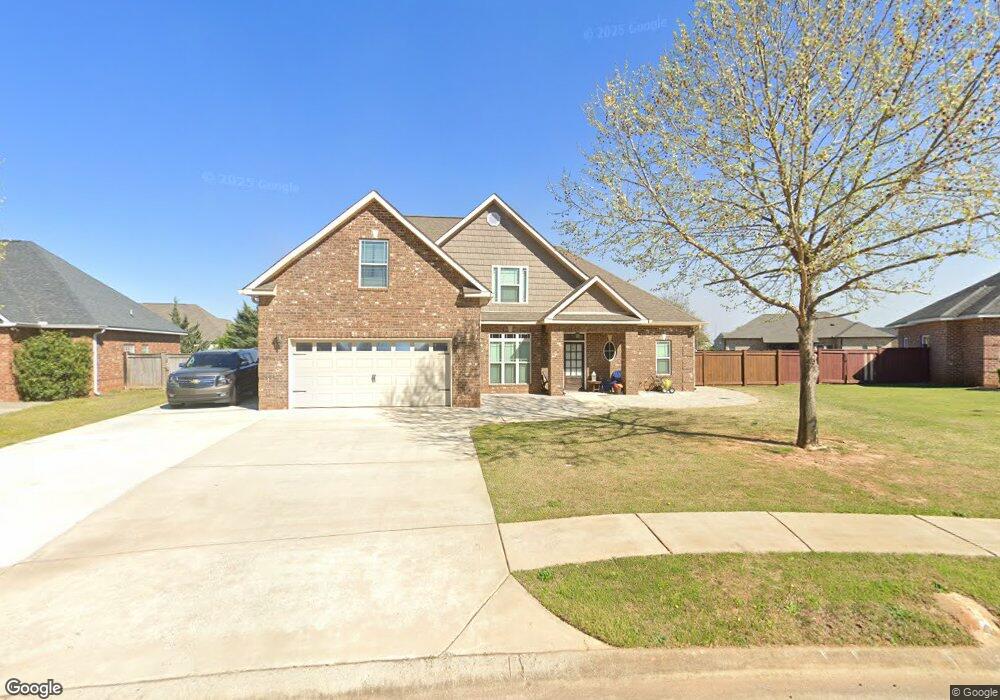
This home is located at 215 Caleb Way, Byron, GA 31008 and is currently estimated at $358,624, approximately $152 per square foot. 215 Caleb Way is a home located in Peach County with nearby schools including Byron Elementary School, Byron Middle School, and Peach County High School.
Ownership History
Date
Name
Owned For
Owner Type
Purchase Details
Closed on
Jul 17, 2017
Sold by
Project Dev & Management Llc
Bought by
Vance Robert K
Current Estimated Value
Home Financials for this Owner
Home Financials are based on the most recent Mortgage that was taken out on this home.
Original Mortgage
$229,842
Outstanding Balance
$191,065
Interest Rate
3.91%
Mortgage Type
VA
Estimated Equity
$167,559
Purchase Details
Closed on
Oct 2, 2014
Sold by
Alexis Investments Llc
Bought by
Project Development & Manage
Purchase Details
Closed on
Feb 24, 2011
Sold by
Newton Development Llc
Bought by
Alexis Investments Llc
Purchase Details
Closed on
Mar 9, 2010
Sold by
Cb&T Bank Of Middle Georgia
Bought by
Newton Development Llc
Purchase Details
Closed on
Sep 2, 2008
Sold by
Theron Homes Inc
Bought by
Cb & T Bank Of Middle Georgia
Purchase Details
Closed on
May 9, 2007
Sold by
Preston Development Llc
Bought by
Theron Homes Inc
Purchase Details
Closed on
Jul 26, 2006
Bought by
Preston Development Llc
Create a Home Valuation Report for This Property
The Home Valuation Report is an in-depth analysis detailing your home's value as well as a comparison with similar homes in the area
Home Values in the Area
Average Home Value in this Area
Purchase History
| Date | Buyer | Sale Price | Title Company |
|---|---|---|---|
| Vance Robert K | $222,500 | -- | |
| Project Development & Manage | $66,300 | -- | |
| Alexis Investments Llc | -- | -- | |
| Newton Development Llc | $30,000 | -- | |
| Cb & T Bank Of Middle Georgia | -- | -- | |
| Theron Homes Inc | -- | -- | |
| Preston Development Llc | -- | -- |
Source: Public Records
Mortgage History
| Date | Status | Borrower | Loan Amount |
|---|---|---|---|
| Open | Vance Robert K | $229,842 |
Source: Public Records
Tax History Compared to Growth
Tax History
| Year | Tax Paid | Tax Assessment Tax Assessment Total Assessment is a certain percentage of the fair market value that is determined by local assessors to be the total taxable value of land and additions on the property. | Land | Improvement |
|---|---|---|---|---|
| 2024 | $4,915 | $137,720 | $12,480 | $125,240 |
| 2023 | $4,823 | $134,280 | $10,000 | $124,280 |
| 2022 | $3,122 | $115,960 | $7,000 | $108,960 |
| 2021 | $3,037 | $97,280 | $7,000 | $90,280 |
| 2020 | $2,746 | $87,960 | $7,000 | $80,960 |
| 2019 | $2,760 | $87,960 | $7,000 | $80,960 |
| 2018 | $2,774 | $87,960 | $7,000 | $80,960 |
| 2017 | $2,700 | $85,200 | $7,000 | $78,200 |
| 2016 | $2,052 | $65,040 | $7,000 | $58,040 |
| 2015 | $221 | $7,000 | $7,000 | $0 |
| 2014 | $154 | $4,880 | $4,880 | $0 |
| 2013 | -- | $4,880 | $4,880 | $0 |
Source: Public Records
Map
Nearby Homes