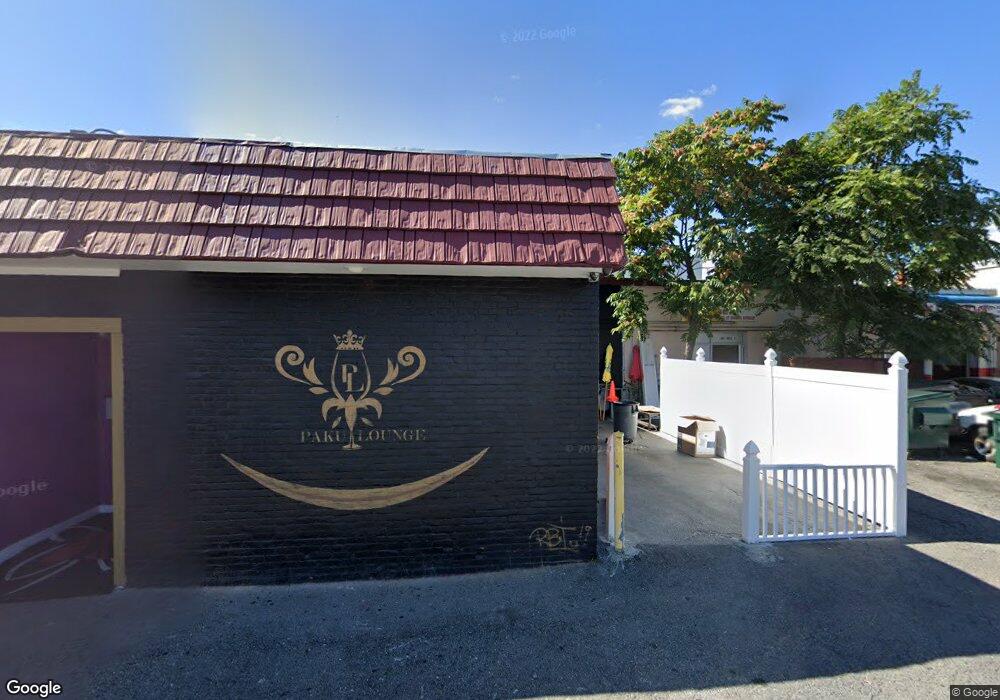
215 Chandler St Worcester, MA 01609
Elm Park NeighborhoodEstimated Value: $1,226,464
--
Bed
--
Bath
7,500
Sq Ft
$164/Sq Ft
Est. Value
About This Home
This home is located at 215 Chandler St, Worcester, MA 01609 and is currently estimated at $1,226,464, approximately $163 per square foot. 215 Chandler St is a home located in Worcester County with nearby schools including Chandler Elementary Community School, Jacob Hiatt Magnet School, and Chandler Magnet.
Ownership History
Date
Name
Owned For
Owner Type
Purchase Details
Closed on
Oct 29, 2009
Sold by
Squibnocket Rt and Motian Michael G
Bought by
S&H Invest Llc
Current Estimated Value
Home Financials for this Owner
Home Financials are based on the most recent Mortgage that was taken out on this home.
Original Mortgage
$250,000
Outstanding Balance
$163,740
Interest Rate
5.06%
Mortgage Type
Commercial
Estimated Equity
$1,062,724
Purchase Details
Closed on
Sep 18, 2003
Sold by
Squibnocket Rt 1999 and Motian Michael G
Bought by
Mass Electric Co
Purchase Details
Closed on
Mar 11, 1999
Sold by
Tuite Charles F
Bought by
Squibnocket Rt 1999 and Motian Michael G
Home Financials for this Owner
Home Financials are based on the most recent Mortgage that was taken out on this home.
Original Mortgage
$280,000
Interest Rate
6.73%
Mortgage Type
Commercial
Create a Home Valuation Report for This Property
The Home Valuation Report is an in-depth analysis detailing your home's value as well as a comparison with similar homes in the area
Home Values in the Area
Average Home Value in this Area
Purchase History
| Date | Buyer | Sale Price | Title Company |
|---|---|---|---|
| S&H Invest Llc | $530,000 | -- | |
| Mass Electric Co | -- | -- | |
| Squibnocket Rt 1999 | $350,000 | -- |
Source: Public Records
Mortgage History
| Date | Status | Borrower | Loan Amount |
|---|---|---|---|
| Open | S&H Invest Llc | $250,000 | |
| Previous Owner | Squibnocket Rt 1999 | $300,000 | |
| Previous Owner | Squibnocket Rt 1999 | $280,000 | |
| Previous Owner | Squibnocket Rt 1999 | $450,000 |
Source: Public Records
Tax History Compared to Growth
Tax History
| Year | Tax Paid | Tax Assessment Tax Assessment Total Assessment is a certain percentage of the fair market value that is determined by local assessors to be the total taxable value of land and additions on the property. | Land | Improvement |
|---|---|---|---|---|
| 2025 | $25,220 | $881,500 | $239,900 | $641,600 |
| 2024 | $23,368 | $777,900 | $239,900 | $538,000 |
| 2023 | $21,119 | $675,600 | $208,700 | $466,900 |
| 2022 | $21,088 | $632,700 | $208,700 | $424,000 |
| 2021 | $22,256 | $614,800 | $158,600 | $456,200 |
| 2020 | $21,616 | $614,800 | $158,600 | $456,200 |
| 2019 | $20,957 | $600,500 | $154,500 | $446,000 |
| 2018 | $20,214 | $594,000 | $154,500 | $439,500 |
| 2017 | $19,560 | $594,000 | $154,500 | $439,500 |
| 2016 | $17,843 | $525,100 | $150,000 | $375,100 |
| 2015 | $16,661 | $525,100 | $150,000 | $375,100 |
| 2014 | $16,189 | $525,100 | $150,000 | $375,100 |
Source: Public Records
Map
Nearby Homes
- 221 Chandler St Unit A
- 221 Chandler St
- 218 Chandler St
- 216 Chandler St
- 222 Chandler St
- 212 Chandler St
- 212 1/2 Chandler St
- 224 Chandler St
- 20 Mason St
- 226 Chandler St
- 4 Winfield St
- 224 1/2 Chandler St
- 210 Chandler St
- 19 Mason St
- 33 Mason St
- 18 Mason St
- 229 Chandler St
- 233 Chandler St
- 8 Winfield St
- 10 Winfield St