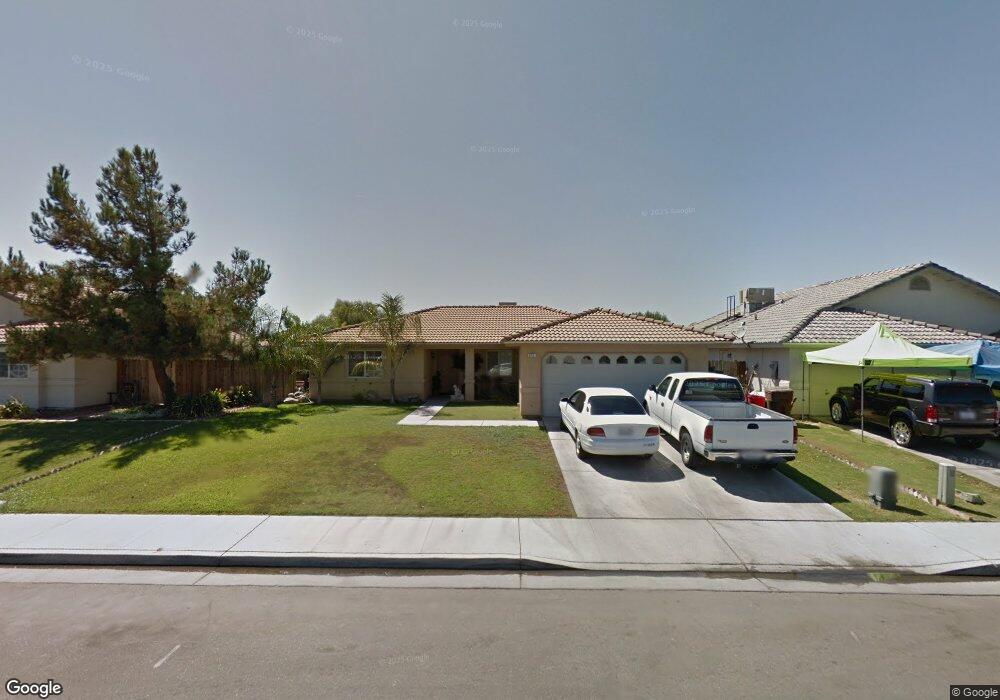
215 Clemson St Shafter, CA 93263
Estimated Value: $292,000 - $357,000
4
Beds
2
Baths
1,440
Sq Ft
$225/Sq Ft
Est. Value
About This Home
This home is located at 215 Clemson St, Shafter, CA 93263 and is currently estimated at $323,424, approximately $224 per square foot. 215 Clemson St is a home located in Kern County with nearby schools including Redwood Elementary School, Golden Oak Elementary School, and Shafter High School.
Ownership History
Date
Name
Owned For
Owner Type
Purchase Details
Closed on
Dec 16, 2008
Sold by
Deutsche Bank National Trust Company
Bought by
Sandoval Ramiro and Sandoval Maria
Current Estimated Value
Home Financials for this Owner
Home Financials are based on the most recent Mortgage that was taken out on this home.
Original Mortgage
$146,062
Outstanding Balance
$93,442
Interest Rate
5.49%
Mortgage Type
FHA
Estimated Equity
$229,982
Purchase Details
Closed on
Feb 11, 2008
Sold by
Soriano Bernardo
Bought by
Deutsche Bank National Trust Co and Financial Asset Securities Corp Soundvie
Purchase Details
Closed on
Jul 11, 2007
Sold by
Soriano Bernardo
Bought by
Soriano Roberto and Soriano Nestor
Purchase Details
Closed on
Jun 14, 2000
Sold by
Parade
Bought by
Soriano Bernardo
Home Financials for this Owner
Home Financials are based on the most recent Mortgage that was taken out on this home.
Original Mortgage
$87,900
Interest Rate
8.19%
Create a Home Valuation Report for This Property
The Home Valuation Report is an in-depth analysis detailing your home's value as well as a comparison with similar homes in the area
Home Values in the Area
Average Home Value in this Area
Purchase History
| Date | Buyer | Sale Price | Title Company |
|---|---|---|---|
| Sandoval Ramiro | $148,000 | First American Title Company | |
| Deutsche Bank National Trust Co | $209,250 | Landsafe Title | |
| Soriano Roberto | -- | None Available | |
| Soriano Bernardo | $88,000 | Commonwealth Land Title Co |
Source: Public Records
Mortgage History
| Date | Status | Borrower | Loan Amount |
|---|---|---|---|
| Open | Sandoval Ramiro | $146,062 | |
| Previous Owner | Soriano Bernardo | $87,900 |
Source: Public Records
Tax History
| Year | Tax Paid | Tax Assessment Tax Assessment Total Assessment is a certain percentage of the fair market value that is determined by local assessors to be the total taxable value of land and additions on the property. | Land | Improvement |
|---|---|---|---|---|
| 2025 | $2,589 | $186,707 | $25,745 | $160,962 |
| 2024 | $2,506 | $183,047 | $25,241 | $157,806 |
| 2023 | $2,506 | $179,459 | $24,747 | $154,712 |
| 2022 | $2,425 | $175,941 | $24,262 | $151,679 |
| 2021 | $2,352 | $172,492 | $23,787 | $148,705 |
| 2020 | $2,352 | $170,725 | $23,544 | $147,181 |
| 2019 | $2,282 | $170,725 | $23,544 | $147,181 |
| 2018 | $2,197 | $164,098 | $22,631 | $141,467 |
| 2017 | $2,181 | $160,882 | $22,188 | $138,694 |
| 2016 | $2,061 | $157,728 | $21,753 | $135,975 |
| 2015 | $1,889 | $144,000 | $36,000 | $108,000 |
| 2014 | $1,921 | $150,000 | $38,000 | $112,000 |
Source: Public Records
Map
Nearby Homes
- 611 Ohanneson Ave
- 421 Chris Ave
- 408 W Euclid Ave
- 9211 Woodbrook Dr
- 245 Atlantic Ave
- 625 Sammy Way
- 707 Sammy Way
- 715 Sammy Way
- 735 Sammy Way
- 605 Lawford St
- 613 Lawford St
- 8743 Sagebrush Ave
- 618 Sammy Way
- 708 Sammy Way
- 720 Sammy Way
- 728 Sammy Way
- 626 Sammy Way
- 716 Sammy Way
- 8728 Brindlewood Ave
- 8724 Brindlewood Ave
- 223 Clemson St
- 207 Clemson St
- 602 Ohanneson Ave
- 235 Clemson St
- 199 Clemson St
- 216 Clemson St
- 208 Clemson St
- 601 Becker Ave
- 224 Clemson St
- 603 Ohanneson Ave
- 248 Knight St
- 247 Clemson St
- 187 Clemson St
- 200 Clemson St
- 610 Ohanneson Ave
- 236 Clemson St
- 196 Clemson St
- 609 Becker Ave
- 248 Clemson St
- 175 Clemson St
Your Personal Tour Guide
Ask me questions while you tour the home.