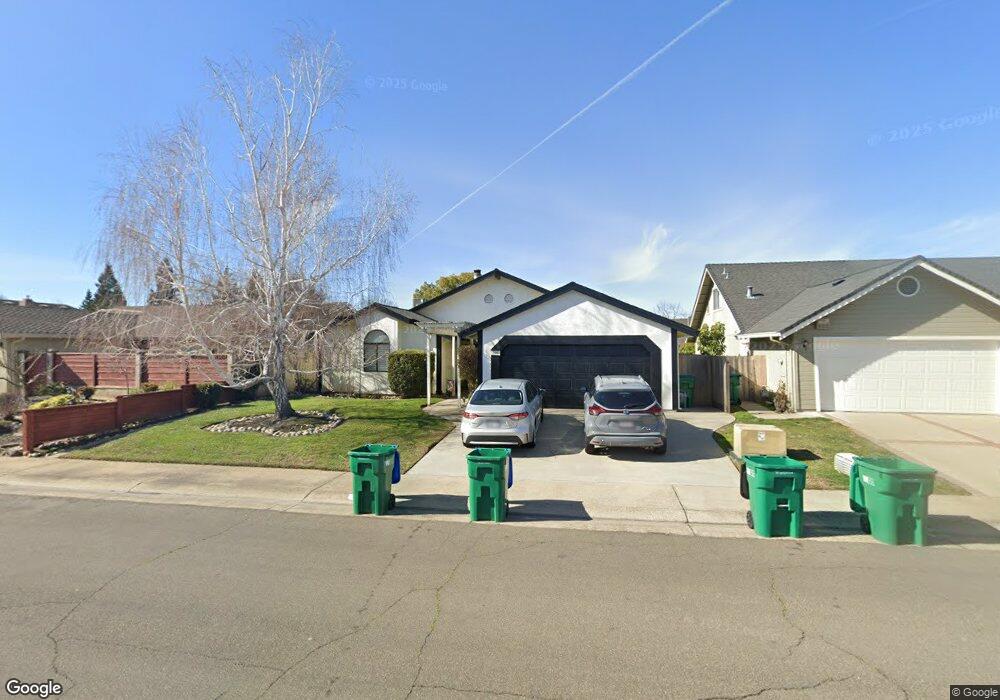
215 Conifer St Lodi, CA 95242
Sunwest NeighborhoodEstimated Value: $405,000 - $550,000
2
Beds
2
Baths
1,513
Sq Ft
$328/Sq Ft
Est. Value
About This Home
This home is located at 215 Conifer St, Lodi, CA 95242 and is currently estimated at $495,513, approximately $327 per square foot. 215 Conifer St is a home located in San Joaquin County with nearby schools including Erma B. Reese Elementary School, Millswood Middle School, and Lodi High School.
Ownership History
Date
Name
Owned For
Owner Type
Purchase Details
Closed on
Feb 6, 2021
Sold by
Jones Cindy I
Bought by
Jones Cindy Illum and The Cindy Illum Jones 2021 Tru
Current Estimated Value
Purchase Details
Closed on
Jul 31, 2006
Sold by
Palmer Lois and Nona Talley Revocable Trust
Bought by
Jones Cindy I
Home Financials for this Owner
Home Financials are based on the most recent Mortgage that was taken out on this home.
Original Mortgage
$293,300
Outstanding Balance
$158,703
Interest Rate
5%
Mortgage Type
Purchase Money Mortgage
Estimated Equity
$336,810
Purchase Details
Closed on
Jul 26, 2002
Sold by
Spivey Guandalene D and Spivey Family Trust
Bought by
Talley Nona and The Nona Talley Ervocable Trus
Purchase Details
Closed on
Jul 23, 1997
Sold by
Haskell Spivey
Bought by
Spivey Haskell R and Spivey Guandalene D
Create a Home Valuation Report for This Property
The Home Valuation Report is an in-depth analysis detailing your home's value as well as a comparison with similar homes in the area
Home Values in the Area
Average Home Value in this Area
Purchase History
| Date | Buyer | Sale Price | Title Company |
|---|---|---|---|
| Jones Cindy Illum | -- | None Available | |
| Jones Cindy I | $367,000 | Old Republic Title Company | |
| Talley Nona | $222,000 | Fidelity National Title Ins | |
| Spivey Haskell R | -- | -- |
Source: Public Records
Mortgage History
| Date | Status | Borrower | Loan Amount |
|---|---|---|---|
| Open | Jones Cindy I | $293,300 |
Source: Public Records
Tax History Compared to Growth
Tax History
| Year | Tax Paid | Tax Assessment Tax Assessment Total Assessment is a certain percentage of the fair market value that is determined by local assessors to be the total taxable value of land and additions on the property. | Land | Improvement |
|---|---|---|---|---|
| 2025 | $5,248 | $491,273 | $196,936 | $294,337 |
| 2024 | $5,103 | $481,641 | $193,075 | $288,566 |
| 2023 | $5,043 | $472,198 | $189,290 | $282,908 |
| 2022 | $4,929 | $462,940 | $185,579 | $277,361 |
| 2021 | $4,560 | $413,000 | $90,000 | $323,000 |
| 2020 | $4,371 | $402,500 | $100,000 | $302,500 |
| 2019 | $4,369 | $402,500 | $100,000 | $302,500 |
| 2018 | $3,785 | $347,500 | $100,000 | $247,500 |
| 2017 | $3,780 | $348,000 | $140,000 | $208,000 |
| 2016 | $3,244 | $313,000 | $125,000 | $188,000 |
| 2015 | $3,089 | $297,000 | $119,000 | $178,000 |
| 2014 | $2,938 | $281,000 | $113,000 | $168,000 |
Source: Public Records
Map
Nearby Homes
- 2633 Bayberry Dr
- 2526 Park West Dr
- 324 Applewood Dr
- 2816 Applewood Dr
- 2651 Douglas Fir Dr
- 3021 Belmont Dr
- 2408 Tejon St
- 2670 Manza Ct
- 991 Harvest Crossing St
- 208 Palomar Dr
- 2585 Buttercup Dr
- 1111 Brighton Way
- 2438 Central Park Dr
- 2495 Macarthur Pkwy
- 208 Gramercy Park Dr
- 3033 Concerto St
- 2107 Yosemite Dr
- 2145 W Pine St
- 2379 Hyde Park Cir
- 2400 Eilers Ln Unit 1703
- 221 Conifer St
- 207 Conifer St
- 212 Evergreen Dr
- 301 Conifer St
- 206 Evergreen Dr
- 218 Evergreen Dr
- 2707 Bayberry Dr
- 2660 Alder Glen Dr
- 300 Evergreen Dr
- 200 Evergreen Dr
- 2663 Bayberry Dr
- 307 Conifer St
- 2654 Alder Glen Dr
- 306 Evergreen Dr
- 2663 Alder Glen Dr
- 2657 Bayberry Dr
- 315 Conifer St
- 2648 Alder Glen Dr
- 312 Evergreen Dr
- 2657 Alder Glen Dr