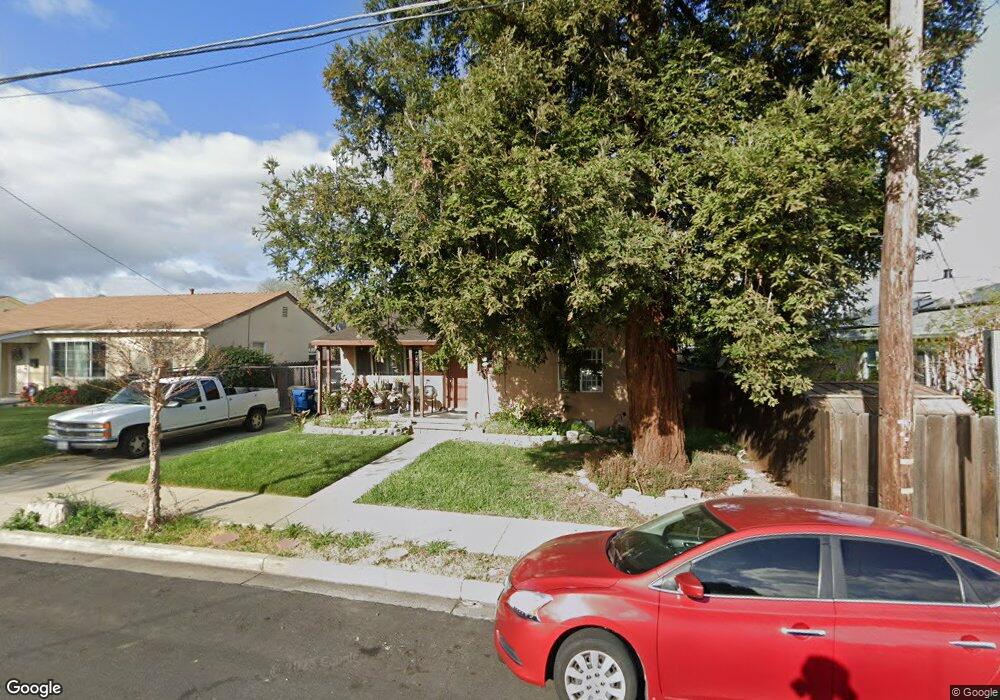
215 Creed Ave Antioch, CA 94509
North Antioch NeighborhoodEstimated Value: $411,000 - $485,926
2
Beds
1
Bath
1,129
Sq Ft
$398/Sq Ft
Est. Value
About This Home
This home is located at 215 Creed Ave, Antioch, CA 94509 and is currently estimated at $449,232, approximately $397 per square foot. 215 Creed Ave is a home located in Contra Costa County with nearby schools including Marsh Elementary School, Antioch Middle School, and Antioch High School.
Ownership History
Date
Name
Owned For
Owner Type
Purchase Details
Closed on
Jul 20, 2007
Sold by
Serrano Odilon and Rodriguez Maria De La Luz
Bought by
Rodriguez Maria De La Luz
Current Estimated Value
Home Financials for this Owner
Home Financials are based on the most recent Mortgage that was taken out on this home.
Original Mortgage
$304,000
Outstanding Balance
$197,322
Interest Rate
7.25%
Mortgage Type
Stand Alone Refi Refinance Of Original Loan
Estimated Equity
$251,910
Purchase Details
Closed on
Nov 4, 2004
Sold by
Snyder Andy M
Bought by
Serrano Odilon and Rodriguez Maria Delaluz
Home Financials for this Owner
Home Financials are based on the most recent Mortgage that was taken out on this home.
Original Mortgage
$260,000
Interest Rate
5.72%
Mortgage Type
Purchase Money Mortgage
Purchase Details
Closed on
Jun 25, 1998
Sold by
Va
Bought by
Snyder Andy M
Create a Home Valuation Report for This Property
The Home Valuation Report is an in-depth analysis detailing your home's value as well as a comparison with similar homes in the area
Home Values in the Area
Average Home Value in this Area
Purchase History
| Date | Buyer | Sale Price | Title Company |
|---|---|---|---|
| Rodriguez Maria De La Luz | -- | Chicago Title Co | |
| Serrano Odilon | $325,000 | First American Title | |
| Snyder Andy M | -- | First American Title |
Source: Public Records
Mortgage History
| Date | Status | Borrower | Loan Amount |
|---|---|---|---|
| Open | Rodriguez Maria De La Luz | $304,000 | |
| Previous Owner | Serrano Odilon | $260,000 | |
| Closed | Serrano Odilon | $65,000 |
Source: Public Records
Tax History Compared to Growth
Tax History
| Year | Tax Paid | Tax Assessment Tax Assessment Total Assessment is a certain percentage of the fair market value that is determined by local assessors to be the total taxable value of land and additions on the property. | Land | Improvement |
|---|---|---|---|---|
| 2025 | $5,507 | $453,006 | $250,896 | $202,110 |
| 2024 | $5,367 | $444,125 | $245,977 | $198,148 |
| 2023 | $5,367 | $435,417 | $241,154 | $194,263 |
| 2022 | $5,283 | $426,880 | $236,426 | $190,454 |
| 2021 | $4,462 | $362,500 | $200,769 | $161,731 |
| 2019 | $4,191 | $332,000 | $183,877 | $148,123 |
| 2018 | $3,568 | $282,500 | $156,461 | $126,039 |
| 2017 | $3,368 | $267,000 | $147,877 | $119,123 |
| 2016 | $3,232 | $256,500 | $142,061 | $114,439 |
| 2015 | $2,695 | $207,500 | $114,923 | $92,577 |
| 2014 | $2,174 | $164,000 | $90,831 | $73,169 |
Source: Public Records
Map
Nearby Homes
- 2101 L St
- 2209 Peppertree Way Unit 1
- 540 W Madill St
- 2118 Peppertree Way Unit 4
- 2101 Lemontree Way Unit 3
- 2205 Lemontree Way Unit 3
- 2304 Peppertree Way Unit 4
- 2401 Peppertree Ct Unit 4
- 2104 Lemontree Way Unit 1
- 2404 Lemontree Ct Unit 1
- 327 W 20th St Unit 329
- 1017 W 14th St
- 500 W 16th St
- 613 W 13th St
- 1228 Buchanan Rd
- 2005 C St
- 832 W 11th St
- 2410 Sunny Ln Unit 26
- 722 W 11th St
- 514 W 12th St
- 213 Creed Ave
- 237 William Reed Dr
- 239 William Reed Dr
- 130 Campbell Ave
- 211 Creed Ave
- 128 Campbell Ave
- 126 Campbell Ave
- 132 Campbell Ave
- 209 Creed Ave
- 212 Creed Ave
- 124 Campbell Ave
- 231 William Reed Dr
- 210 Creed Ave
- 236 William Reed Dr
- 238 William Reed Dr
- 207 Creed Ave
- 240 William Reed Dr
- 208 Creed Ave
- 122 Campbell Ave
- 232 William Reed Dr