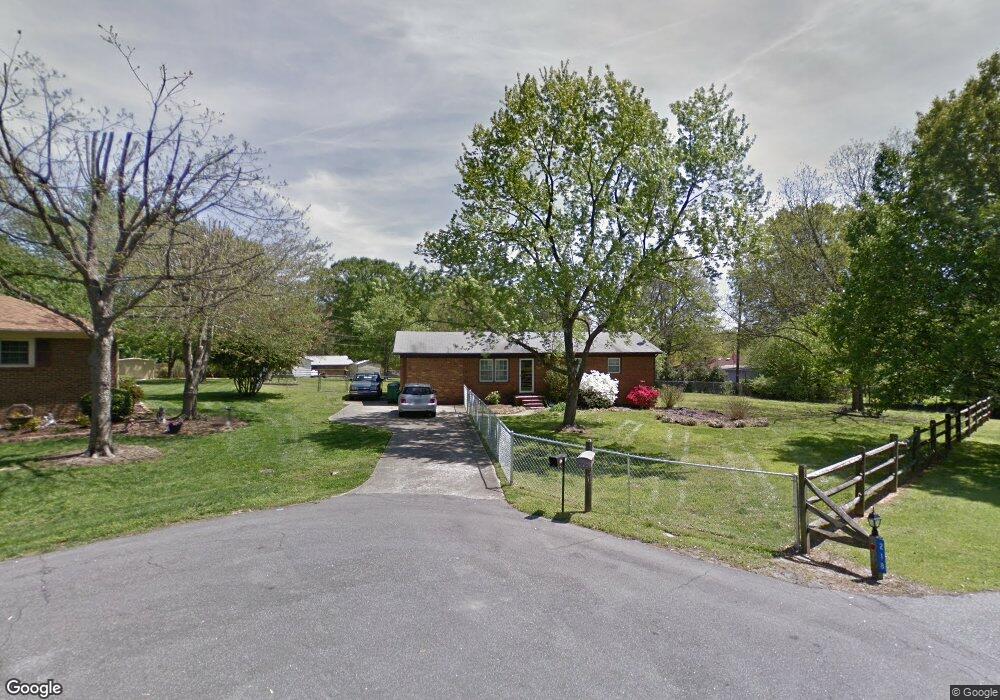
215 Drye Ln Matthews, NC 28104
Estimated Value: $260,000 - $388,000
3
Beds
2
Baths
1,300
Sq Ft
$252/Sq Ft
Est. Value
About This Home
This home is located at 215 Drye Ln, Matthews, NC 28104 and is currently estimated at $327,384, approximately $251 per square foot. 215 Drye Ln is a home located in Union County with nearby schools including Indian Trail Elementary School, Sun Valley Middle School, and Sun Valley High School.
Ownership History
Date
Name
Owned For
Owner Type
Purchase Details
Closed on
Dec 15, 2022
Sold by
Dougherty Kathy H
Bought by
Ross And Ross Investments Llc
Current Estimated Value
Purchase Details
Closed on
May 29, 2013
Sold by
Smith David M and Smith Tracey A
Bought by
Dougherty Kathy H
Home Financials for this Owner
Home Financials are based on the most recent Mortgage that was taken out on this home.
Original Mortgage
$90,000
Interest Rate
3.42%
Mortgage Type
New Conventional
Purchase Details
Closed on
Jun 25, 1999
Sold by
Jameson Jeffrey A and Jameson Crystal G
Bought by
Smith David M and Painter Tracey A
Home Financials for this Owner
Home Financials are based on the most recent Mortgage that was taken out on this home.
Original Mortgage
$89,264
Interest Rate
7.13%
Mortgage Type
FHA
Create a Home Valuation Report for This Property
The Home Valuation Report is an in-depth analysis detailing your home's value as well as a comparison with similar homes in the area
Purchase History
| Date | Buyer | Sale Price | Title Company |
|---|---|---|---|
| Ross And Ross Investments Llc | $165,000 | -- | |
| Dougherty Kathy H | $100,000 | None Available | |
| Smith David M | $90,000 | -- |
Source: Public Records
Mortgage History
| Date | Status | Borrower | Loan Amount |
|---|---|---|---|
| Previous Owner | Dougherty Kathy H | $90,000 | |
| Previous Owner | Smith David M | $89,264 |
Source: Public Records
Tax History
| Year | Tax Paid | Tax Assessment Tax Assessment Total Assessment is a certain percentage of the fair market value that is determined by local assessors to be the total taxable value of land and additions on the property. | Land | Improvement |
|---|---|---|---|---|
| 2025 | $1,949 | $281,100 | $0 | $0 |
| 2024 | $1,758 | $197,200 | $39,800 | $157,400 |
| 2023 | $1,656 | $193,400 | $39,800 | $153,600 |
| 2022 | $1,635 | $193,400 | $39,800 | $153,600 |
| 2021 | $1,634 | $193,400 | $39,800 | $153,600 |
| 2020 | $1,079 | $103,170 | $19,670 | $83,500 |
| 2019 | $1,074 | $103,170 | $19,670 | $83,500 |
| 2018 | $1,074 | $103,170 | $19,670 | $83,500 |
| 2017 | $1,080 | $103,200 | $19,700 | $83,500 |
| 2016 | $1,111 | $103,170 | $19,670 | $83,500 |
| 2015 | $1,122 | $103,170 | $19,670 | $83,500 |
| 2014 | $679 | $95,880 | $20,490 | $75,390 |
Source: Public Records
Map
Nearby Homes
- 0 Greenbriar Dr
- 132 Greenbriar Dr
- 1224 Vickie Ln
- 1021 Vickie Ln
- 1211 May Apple Dr
- 1105 May Apple Dr
- 2102 Trout Lily Ln
- 2105 Autumn Olive Ln
- 2409 Autumn Olive Ln
- 3501 Timber Mill Dr
- 2108 Stallings Rd
- 3404 Timber Mill Dr
- 300 Forest Park Rd
- 8128 Sapwood Ct
- 2208 Community Park Dr
- 185 Marron Dr
- 138 Marron Dr
- 206 Marron Dr
- 0000 White Oak Ln
- 309 Catawba Cir N
Your Personal Tour Guide
Ask me questions while you tour the home.