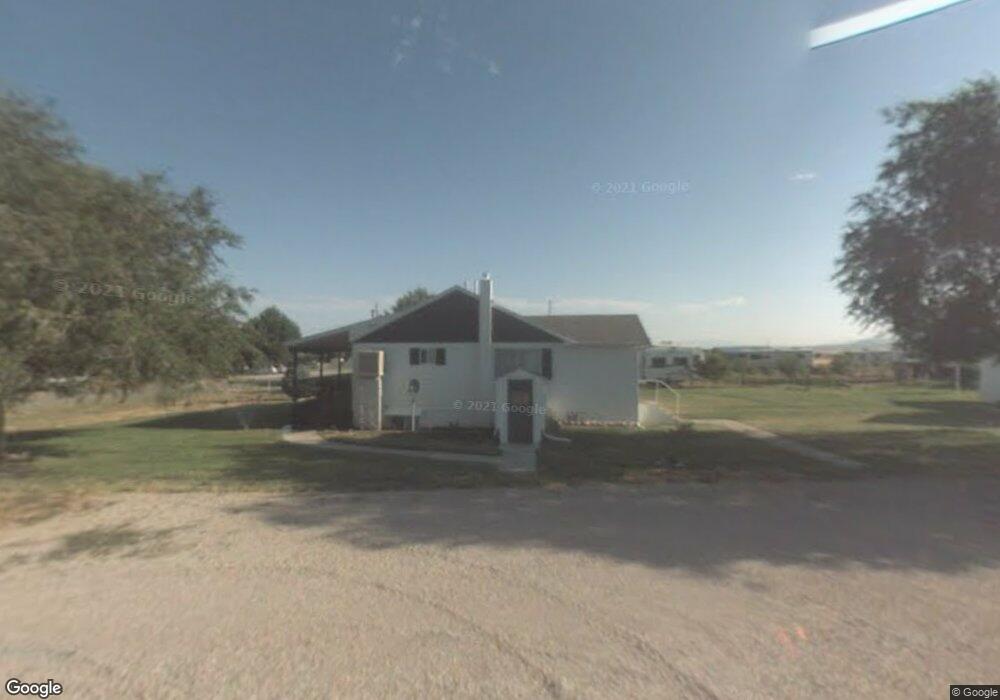
215 E 100 S Kanosh, UT 84637
Estimated Value: $291,000 - $643,000
4
Beds
2
Baths
1,984
Sq Ft
$235/Sq Ft
Est. Value
About This Home
This home is located at 215 E 100 S, Kanosh, UT 84637 and is currently estimated at $467,000, approximately $235 per square foot. 215 E 100 S is a home located in Millard County.
Ownership History
Date
Name
Owned For
Owner Type
Purchase Details
Closed on
Apr 10, 2025
Sold by
Johnson Jarom B
Bought by
Johnson Ammon Jessop
Current Estimated Value
Home Financials for this Owner
Home Financials are based on the most recent Mortgage that was taken out on this home.
Original Mortgage
$320,000
Outstanding Balance
$312,142
Interest Rate
5.94%
Mortgage Type
Balloon
Estimated Equity
$154,858
Purchase Details
Closed on
Sep 26, 2018
Sold by
Rust Alvin E
Bought by
Johnson Jarom B
Create a Home Valuation Report for This Property
The Home Valuation Report is an in-depth analysis detailing your home's value as well as a comparison with similar homes in the area
Purchase History
| Date | Buyer | Sale Price | Title Company |
|---|---|---|---|
| Johnson Ammon Jessop | -- | Inwest Title | |
| Johnson Ammon Jessop | -- | Inwest Title | |
| Johnson Jarom B | -- | -- |
Source: Public Records
Mortgage History
| Date | Status | Borrower | Loan Amount |
|---|---|---|---|
| Open | Johnson Ammon Jessop | $320,000 | |
| Closed | Johnson Ammon Jessop | $320,000 |
Source: Public Records
Tax History
| Year | Tax Paid | Tax Assessment Tax Assessment Total Assessment is a certain percentage of the fair market value that is determined by local assessors to be the total taxable value of land and additions on the property. | Land | Improvement |
|---|---|---|---|---|
| 2025 | $1,175 | $153,972 | $29,998 | $123,974 |
| 2024 | $1,175 | $146,563 | $15,642 | $130,921 |
| 2023 | $1,372 | $146,563 | $15,642 | $130,921 |
| 2022 | $910 | $85,469 | $12,514 | $72,955 |
| 2021 | $923 | $83,649 | $10,881 | $72,768 |
| 2020 | $800 | $73,206 | $9,892 | $63,314 |
| 2019 | $722 | $66,372 | $9,075 | $57,297 |
| 2018 | $636 | $59,910 | $8,250 | $51,660 |
| 2017 | $665 | $59,910 | $8,250 | $51,660 |
| 2016 | $499 | $46,929 | $6,188 | $40,741 |
| 2015 | $499 | $46,929 | $6,188 | $40,741 |
| 2014 | -- | $46,929 | $6,188 | $40,741 |
| 2013 | -- | $46,929 | $6,188 | $40,741 |
Source: Public Records
Map
Nearby Homes
- 58 E 300 South St
- 135 E 200 N
- 8610 S Highway 91
- Parcel # 8816
- 145 N 200 E
- 50 N 100 Rd E
- 1565 W Sunflower Ln Unit 3
- 1615 W Sunflower Ln
- 1615 W Sunflower Ln Unit 4
- 1565 W Sunflower Ln
- 2000 N West Frontage I-15
- 0 Tbd Black Rock Rd Unit LotWP001
- 1100 S 725 Rd W
- 310 S 500 West Rd
- 465 S 100 W
- 760 E 700 St S
- 155 E 500 St S
- 157 E 500 South St
- 405 E 500 St S
- 260 W 200 S
Your Personal Tour Guide
Ask me questions while you tour the home.