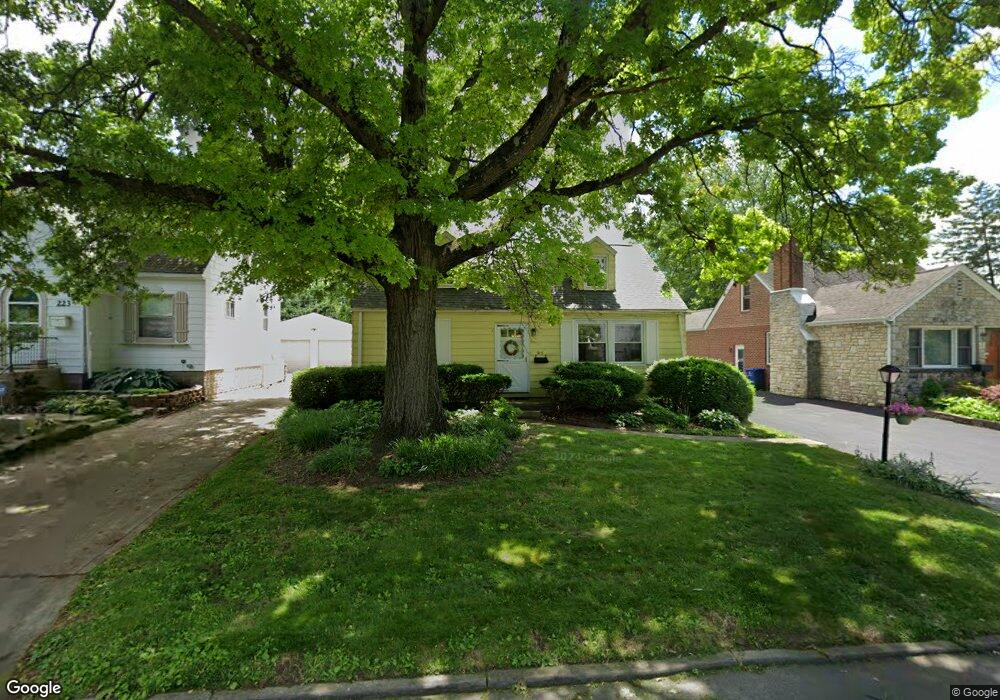
215 E Beaumont Rd Columbus, OH 43214
Clintonville NeighborhoodEstimated Value: $341,000 - $410,000
2
Beds
2
Baths
1,350
Sq Ft
$285/Sq Ft
Est. Value
About This Home
This home is located at 215 E Beaumont Rd, Columbus, OH 43214 and is currently estimated at $384,207, approximately $284 per square foot. 215 E Beaumont Rd is a home located in Franklin County with nearby schools including Indian Springs Elementary School, Dominion Middle School, and Whetstone High School.
Ownership History
Date
Name
Owned For
Owner Type
Purchase Details
Closed on
May 10, 2020
Sold by
Anderseon Michael G and Schultz Ernette J
Bought by
Schultz Scott E and Anderson Schultz Keystone Pres
Current Estimated Value
Purchase Details
Closed on
Jul 30, 2019
Sold by
Schultz Scott E
Bought by
Anderson Michael G and Schultz Ernette J
Purchase Details
Closed on
Feb 23, 2015
Sold by
Anderson Michael G
Bought by
Schultz Scott E and The Anderson Schultz Keystone
Purchase Details
Closed on
Aug 21, 1987
Create a Home Valuation Report for This Property
The Home Valuation Report is an in-depth analysis detailing your home's value as well as a comparison with similar homes in the area
Home Values in the Area
Average Home Value in this Area
Purchase History
| Date | Buyer | Sale Price | Title Company |
|---|---|---|---|
| Schultz Scott E | -- | None Available | |
| Anderson Michael G | -- | None Available | |
| Schultz Scott E | -- | None Available | |
| Schultz Scott E | -- | None Available | |
| -- | -- | -- |
Source: Public Records
Tax History
| Year | Tax Paid | Tax Assessment Tax Assessment Total Assessment is a certain percentage of the fair market value that is determined by local assessors to be the total taxable value of land and additions on the property. | Land | Improvement |
|---|---|---|---|---|
| 2025 | $4,670 | $104,060 | $52,680 | $51,380 |
| 2024 | $4,670 | $104,060 | $52,680 | $51,380 |
| 2023 | $4,610 | $104,060 | $52,680 | $51,380 |
| 2022 | $4,281 | $82,540 | $37,560 | $44,980 |
| 2021 | $4,289 | $82,540 | $37,560 | $44,980 |
| 2020 | $3,839 | $82,540 | $37,560 | $44,980 |
| 2019 | $3,336 | $63,740 | $28,880 | $34,860 |
| 2018 | $3,086 | $63,740 | $28,880 | $34,860 |
| 2017 | $3,233 | $63,740 | $28,880 | $34,860 |
| 2016 | $3,133 | $56,040 | $21,490 | $34,550 |
| 2015 | $2,844 | $56,040 | $21,490 | $34,550 |
| 2014 | $2,851 | $56,040 | $21,490 | $34,550 |
| 2013 | -- | $53,375 | $20,475 | $32,900 |
Source: Public Records
Map
Nearby Homes
- 144 Wetmore Rd
- 53 E Beechwold Blvd
- 389 Wetmore Rd
- 103 E Jeffrey Place
- 243 E Schreyer Place
- 4938 Fairway Ct Unit 4938-4944
- 62 W Rathbone Ave
- 4299 Colerain Ave
- 5019 N High St Unit 82
- 122 W Rathbone Ave
- 4464 Zeller Rd
- 601 Morse Rd
- 702 E Weisheimer Rd
- 238 W Henderson Rd
- 4466 Olentangy Blvd
- 325 Starrett Ct
- 4374 Scenic Dr
- 82 Blenheim Rd
- 827 Inwood Place
- 5200 Fenway Ct Unit B
- 223 E Beaumont Rd
- 209 E Beaumont Rd
- 229 E Beaumont Rd
- 201 E Beaumont Rd
- 195 E Beaumont Rd
- 216 Garden Rd
- 210 Garden Rd
- 243 E Beaumont Rd
- 222 Garden Rd
- 189 E Beaumont Rd
- 224 E Beaumont Rd
- 204 Garden Rd
- 228 Garden Rd
- 230 E Beaumont Rd
- 196 Garden Rd
- 216 E Beaumont Rd
- 210 E Beaumont Rd
- 249 E Beaumont Rd
- 181 E Beaumont Rd
- 204 E Beaumont Rd
Your Personal Tour Guide
Ask me questions while you tour the home.