Estimated Value: $86,587 - $118,000
2
Beds
1
Bath
769
Sq Ft
$129/Sq Ft
Est. Value
About This Home
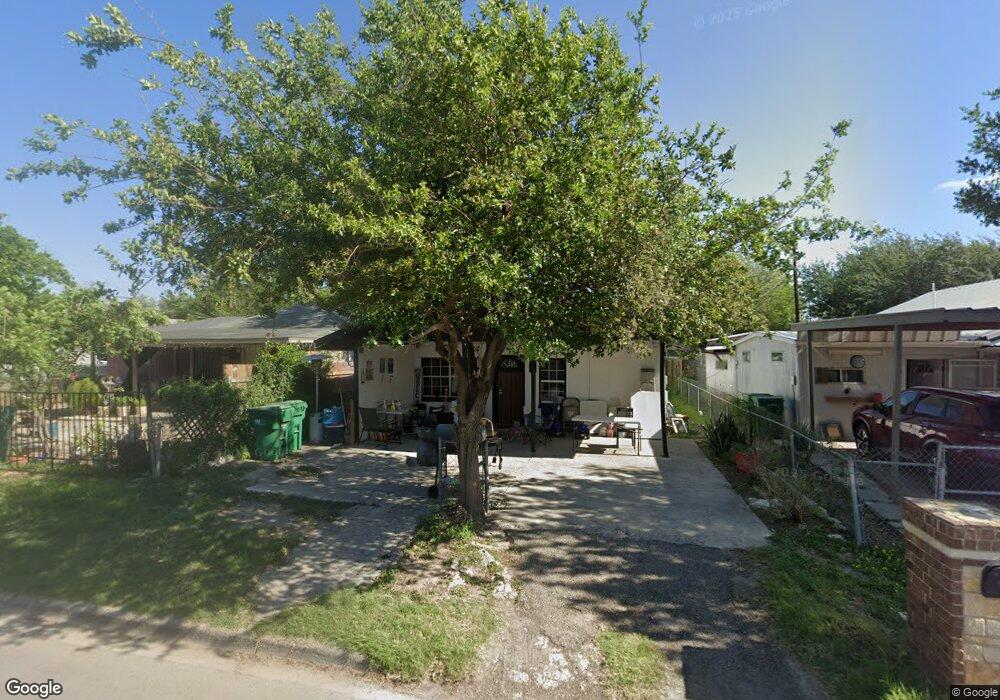
This home is located at 215 E Brady St, Pharr, TX 78577 and is currently estimated at $99,196, approximately $128 per square foot. 215 E Brady St is a home located in Hidalgo County with nearby schools including Raul Longoria Elementary School, Lyndon B. Johnson Middle School, and PSJA North Early College High School.
Ownership History
Date
Name
Owned For
Owner Type
Purchase Details
Closed on
May 20, 2022
Sold by
Garcia Salazar Jesus
Bought by
Salazar Mary Bell
Current Estimated Value
Purchase Details
Closed on
Jul 16, 2014
Sold by
Gaston Bob A
Bought by
Rocha Luz Elena and Cortez Hector
Home Financials for this Owner
Home Financials are based on the most recent Mortgage that was taken out on this home.
Original Mortgage
$27,200
Interest Rate
4.17%
Mortgage Type
Purchase Money Mortgage
Purchase Details
Closed on
Dec 22, 2010
Sold by
Rio Grande Estates Llc
Bought by
Salazar Jesus and Vela Nereyda E
Home Financials for this Owner
Home Financials are based on the most recent Mortgage that was taken out on this home.
Original Mortgage
$24,500
Interest Rate
4.41%
Mortgage Type
Seller Take Back
Create a Home Valuation Report for This Property
The Home Valuation Report is an in-depth analysis detailing your home's value as well as a comparison with similar homes in the area
Home Values in the Area
Average Home Value in this Area
Purchase History
| Date | Buyer | Sale Price | Title Company |
|---|---|---|---|
| Salazar Mary Bell | -- | None Listed On Document | |
| Rocha Luz Elena | -- | None Available | |
| Salazar Jesus | -- | None Available |
Source: Public Records
Mortgage History
| Date | Status | Borrower | Loan Amount |
|---|---|---|---|
| Previous Owner | Rocha Luz Elena | $27,200 | |
| Previous Owner | Salazar Jesus | $24,500 |
Source: Public Records
Tax History
| Year | Tax Paid | Tax Assessment Tax Assessment Total Assessment is a certain percentage of the fair market value that is determined by local assessors to be the total taxable value of land and additions on the property. | Land | Improvement |
|---|---|---|---|---|
| 2025 | $1,204 | $57,718 | $20,126 | $37,592 |
| 2024 | $1,204 | $44,882 | $18,296 | $26,586 |
| 2023 | $1,203 | $44,882 | $18,296 | $26,586 |
| 2022 | $880 | $31,367 | $0 | $0 |
| 2021 | $815 | $28,515 | $11,900 | $23,701 |
| 2020 | $750 | $25,923 | $11,900 | $21,583 |
| 2019 | $691 | $23,566 | $7,438 | $16,128 |
| 2018 | $695 | $23,566 | $7,438 | $16,128 |
| 2017 | $701 | $23,566 | $7,438 | $16,128 |
| 2016 | $679 | $22,840 | $7,438 | $15,402 |
| 2015 | $438 | $22,840 | $7,438 | $15,402 |
Source: Public Records
Map
Nearby Homes
- 207 E Diaz Ave
- 2016 N Cage Blvd
- 2400 S Cage Blvd
- 5704 N Ebony St
- 1701 N Ebony St
- 00 E Ferguson Ave
- 1909 N Gumwood St
- 905 E Brady Cir
- 912 E Brady Cir
- 746 Sharm Dr
- 921 E Alan St
- 313 E Meandering Way Ave
- 1007 E Bagwell St
- 809 E Ferguson St
- 4713 N Juniper St
- 1010 E Bagwell St
- 2704 N Dahlia St
- 701 Cancun
- 204 W Eller Ave
- 304 & 306 E Polk Ave
Your Personal Tour Guide
Ask me questions while you tour the home.