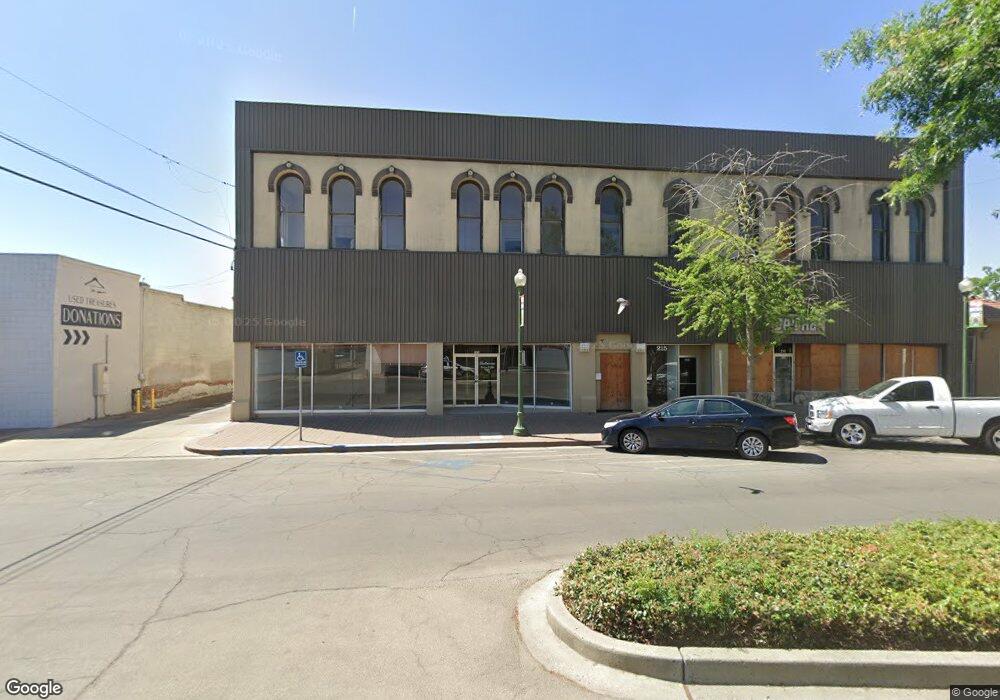
215 E Kern Ave Tulare, CA 93274
1
Bed
1
Bath
11,800
Sq Ft
7,405
Sq Ft Lot
About This Home
This home is located at 215 E Kern Ave, Tulare, CA 93274. 215 E Kern Ave is a home located in Tulare County with nearby schools including Wilson Elementary School, Cherry Avenue Middle School, and Tulare Union High School.
Ownership History
Date
Name
Owned For
Owner Type
Purchase Details
Closed on
Jul 23, 2025
Sold by
Vlazakis/Ametjian Family Trust and 2017 John And Maria Barbis Revocable Tru
Bought by
Dt Oasis Llc
Home Financials for this Owner
Home Financials are based on the most recent Mortgage that was taken out on this home.
Original Mortgage
$1,000,000
Interest Rate
6.58%
Mortgage Type
New Conventional
Purchase Details
Closed on
Mar 19, 2019
Sold by
Vlazakis Emmanuel P
Bought by
Vlazakis Emmanuel and Ametjian Paula C
Purchase Details
Closed on
Apr 27, 2017
Sold by
Barbis Maria A
Bought by
Barbis John A and Barbis Maria A
Purchase Details
Closed on
Jun 29, 2009
Sold by
Vlazakis Emmanuel P and Vlazakis Athanasia V
Bought by
Vlazakis Emmanuel P and Vlazakis Athanasia
Purchase Details
Closed on
Apr 22, 2009
Sold by
Tulare Redevelopment Agency
Bought by
Vlazakis Emmanuel P and Vlazakis Athanasia
Purchase Details
Closed on
Dec 16, 2003
Sold by
Vlazakis Emmanuel P
Bought by
Vlazakis Athanasia and Vlazakis Emmanuel P
Purchase Details
Closed on
Oct 5, 1994
Sold by
Vlazakis Gust Constantine
Bought by
Vlazakis Constantine and Vlazakis Yvonne
Create a Home Valuation Report for This Property
The Home Valuation Report is an in-depth analysis detailing your home's value as well as a comparison with similar homes in the area
Home Values in the Area
Average Home Value in this Area
Purchase History
| Date | Buyer | Sale Price | Title Company |
|---|---|---|---|
| Dt Oasis Llc | $180,000 | Stewart Title Of California | |
| Vlazakis Emmanuel | -- | None Available | |
| Barbis John A | -- | None Available | |
| Vlazakis Emmanuel P | -- | Chicago Title Company | |
| Vlazakis Emmanuel P | -- | Chicago Title Company | |
| Vlazakis Athanasia | -- | -- | |
| Vlazakis Constantine | -- | -- |
Source: Public Records
Mortgage History
| Date | Status | Borrower | Loan Amount |
|---|---|---|---|
| Previous Owner | Dt Oasis Llc | $1,000,000 |
Source: Public Records
Tax History
| Year | Tax Paid | Tax Assessment Tax Assessment Total Assessment is a certain percentage of the fair market value that is determined by local assessors to be the total taxable value of land and additions on the property. | Land | Improvement |
|---|---|---|---|---|
| 2025 | $983 | $90,292 | $90,292 | -- |
| 2024 | $983 | $88,522 | $88,522 | -- |
| 2023 | $958 | $86,787 | $86,787 | $0 |
| 2022 | $3,844 | $351,802 | $85,086 | $266,716 |
| 2021 | $3,795 | $344,904 | $83,418 | $261,486 |
| 2020 | $3,859 | $341,368 | $82,563 | $258,805 |
| 2019 | $3,956 | $334,674 | $80,944 | $253,730 |
| 2018 | $3,892 | $328,112 | $79,357 | $248,755 |
| 2017 | $3,856 | $321,678 | $77,801 | $243,877 |
| 2016 | $3,688 | $315,370 | $76,275 | $239,095 |
| 2015 | $3,564 | $310,633 | $75,129 | $235,504 |
| 2014 | $3,564 | $304,548 | $73,657 | $230,891 |
Source: Public Records
Map
Nearby Homes
- 0 0 Unit CV26015491
- 202 N L St
- 815 E Sycamore Ave
- 861 E Sycamore Ave
- 257 N F St
- 348 N F St
- 234 S D St
- 129 S C St
- 560 N F St
- 1072 E Sycamore Ave
- 707 W Sonora Ave
- 840 E Bardsley Ave
- 320 N Blackstone St Unit 14
- 908 N Beatrice Dr
- 947 W Kern Ave
- 0 Spruce St S Unit 239148
- 0 Spruce St S Unit 233400
- 130 E Woodward Dr
- 1112 W San Joaquin Ave
- 1 Spruce St
Your Personal Tour Guide
Ask me questions while you tour the home.