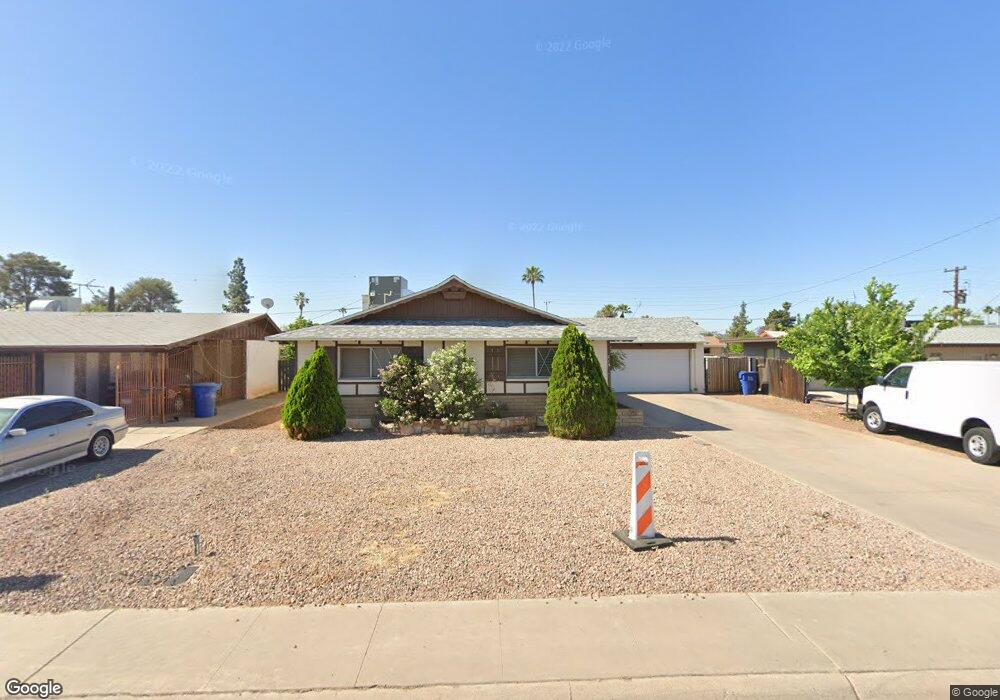
215 E Pebble Beach Dr Tempe, AZ 85282
Alameda NeighborhoodEstimated Value: $397,582 - $512,000
Studio
2
Baths
1,522
Sq Ft
$308/Sq Ft
Est. Value
About This Home
This home is located at 215 E Pebble Beach Dr, Tempe, AZ 85282 and is currently estimated at $469,396, approximately $308 per square foot. 215 E Pebble Beach Dr is a home located in Maricopa County with nearby schools including Carminati Elementary School, Connolly Middle School, and Tempe High School.
Ownership History
Date
Name
Owned For
Owner Type
Purchase Details
Closed on
Mar 8, 2012
Sold by
Spiro Samir Nazir and Spiro Miladeh R
Bought by
Spiro Samir Nazir and Spiro Miladeh E
Current Estimated Value
Purchase Details
Closed on
Nov 15, 1995
Sold by
Kurz Robert W
Bought by
Erdmann Eilt
Home Financials for this Owner
Home Financials are based on the most recent Mortgage that was taken out on this home.
Original Mortgage
$65,000
Outstanding Balance
$452
Interest Rate
7.51%
Estimated Equity
$468,944
Purchase Details
Closed on
Oct 18, 1995
Sold by
Erdmann Eilt
Bought by
Spiro Sam and Spiro Miladeh
Home Financials for this Owner
Home Financials are based on the most recent Mortgage that was taken out on this home.
Original Mortgage
$65,000
Outstanding Balance
$452
Interest Rate
7.51%
Estimated Equity
$468,944
Purchase Details
Closed on
Aug 8, 1995
Sold by
Pyle Diane
Bought by
Erdmann Eili J
Purchase Details
Closed on
Feb 18, 1995
Sold by
Erdmann Eilr J and Erdmann Marjorie
Bought by
Kurz Alice U
Create a Home Valuation Report for This Property
The Home Valuation Report is an in-depth analysis detailing your home's value as well as a comparison with similar homes in the area
Home Values in the Area
Average Home Value in this Area
Purchase History
| Date | Buyer | Sale Price | Title Company |
|---|---|---|---|
| Spiro Samir Nazir | -- | None Available | |
| Erdmann Eilt | -- | Transamerica Title Ins Co | |
| Erdmann Eilt | -- | Transamerica Title Ins Co | |
| Spiro Sam | $90,000 | Transamerica Title Ins Co | |
| Erdmann Eili J | -- | -- | |
| Pyle Diane | -- | -- | |
| Kurz Alice U | -- | -- |
Source: Public Records
Mortgage History
| Date | Status | Borrower | Loan Amount |
|---|---|---|---|
| Open | Spiro Sam | $65,000 |
Source: Public Records
Tax History
| Year | Tax Paid | Tax Assessment Tax Assessment Total Assessment is a certain percentage of the fair market value that is determined by local assessors to be the total taxable value of land and additions on the property. | Land | Improvement |
|---|---|---|---|---|
| 2025 | $2,003 | $19,209 | -- | -- |
| 2024 | $1,837 | $18,294 | -- | -- |
| 2023 | $1,837 | $36,850 | $7,370 | $29,480 |
| 2022 | $1,755 | $28,000 | $5,600 | $22,400 |
| 2021 | $1,789 | $25,750 | $5,150 | $20,600 |
| 2020 | $1,730 | $23,500 | $4,700 | $18,800 |
| 2019 | $1,697 | $22,220 | $4,440 | $17,780 |
| 2018 | $1,651 | $20,170 | $4,030 | $16,140 |
| 2017 | $1,600 | $18,580 | $3,710 | $14,870 |
| 2016 | $1,592 | $17,930 | $3,580 | $14,350 |
| 2015 | $1,540 | $14,860 | $2,970 | $11,890 |
Source: Public Records
Map
Nearby Homes
- 206 E Manhatton Dr
- 122 E Hermosa Dr
- 14 E Hermosa Dr Unit 47
- 200 E Southern Ave Unit 160
- 200 E Southern Ave Unit 242
- 3224 S El Camino Dr
- 534 E Pebble Beach Dr
- 644 E La Jolla Dr
- 233 E Erie Dr
- 650 E Malibu Dr
- 4517 S Grandview Ave
- 516 E Greenway Dr
- 3 E Erie Dr
- 320 W Laguna Dr
- 307 W Santa Cruz Dr
- 22332 W Dnp Test Listing St E Unit 29
- 735 E Manhatton Dr
- 4617 S Grandview Ave
- 928 E La Jolla Dr
- 528 W La Jolla Dr
- 221 E Pebble Beach Dr
- 209 E Pebble Beach Dr
- 210 E La Jolla Dr
- 227 E Pebble Beach Dr
- 204 E La Jolla Dr
- 203 E Pebble Beach Dr
- 216 E La Jolla Dr
- 140 E La Jolla Dr
- 224 E La Jolla Dr
- 233 E Pebble Beach Dr
- 214 E Pebble Beach Dr
- 220 E Pebble Beach Dr
- 137 E Pebble Beach Dr
- 208 E Pebble Beach Dr
- 134 E La Jolla Dr
- 226 E Pebble Beach Dr
- 230 E La Jolla Dr
- 0000 S Xxxxxxxxx St
- 202 E Pebble Beach Dr
- 239 E Pebble Beach Dr
Your Personal Tour Guide
Ask me questions while you tour the home.