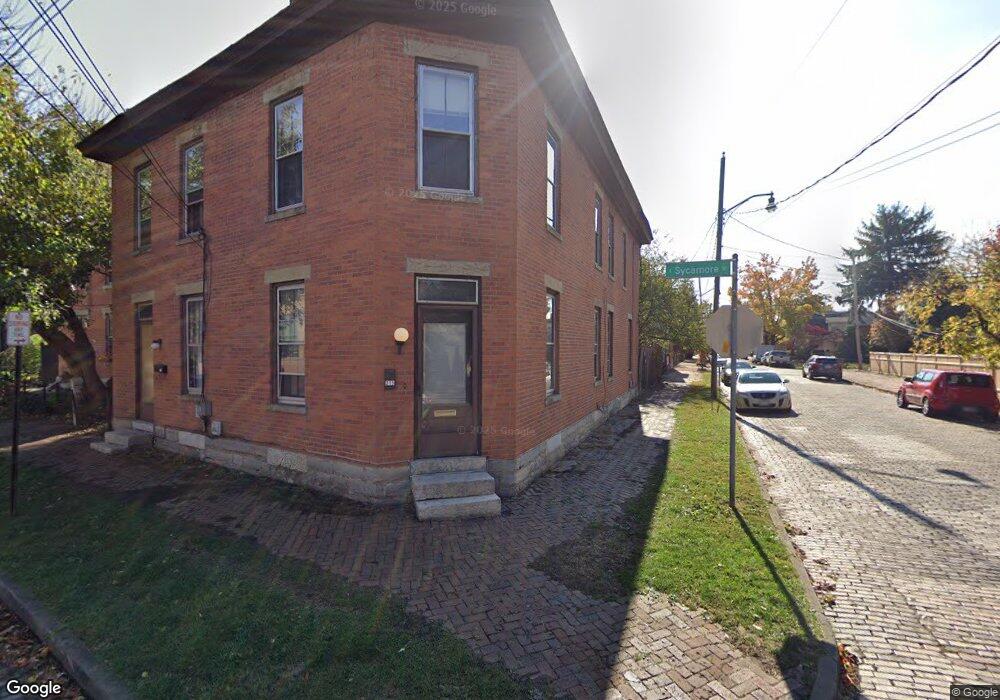
215 E Sycamore St Unit 217 Columbus, OH 43206
German Village NeighborhoodEstimated Value: $840,000 - $916,000
6
Beds
5
Baths
3,288
Sq Ft
$268/Sq Ft
Est. Value
About This Home
This home is located at 215 E Sycamore St Unit 217, Columbus, OH 43206 and is currently estimated at $882,692, approximately $268 per square foot. 215 E Sycamore St Unit 217 is a home located in Franklin County with nearby schools including Siebert Elementary School, South High School, and South Columbus Preparatory Academy.
Ownership History
Date
Name
Owned For
Owner Type
Purchase Details
Closed on
Jun 18, 2021
Sold by
Cope Stephanie and Cope Jonathan M
Bought by
Mortazavi Amir and Pedram Tannan
Current Estimated Value
Home Financials for this Owner
Home Financials are based on the most recent Mortgage that was taken out on this home.
Original Mortgage
$570,000
Interest Rate
2.9%
Mortgage Type
New Conventional
Purchase Details
Closed on
Feb 19, 2021
Sold by
Day Robert P
Bought by
Cope Stephanie and Cope Jonathan M
Purchase Details
Closed on
Apr 15, 2004
Sold by
Day Marlyn C
Bought by
Day Marlyn C and Marlyn C Day Irrevocable Trust
Purchase Details
Closed on
Jul 26, 1989
Bought by
Day Marlyn C
Purchase Details
Closed on
Jul 1, 1984
Purchase Details
Closed on
Nov 1, 1980
Create a Home Valuation Report for This Property
The Home Valuation Report is an in-depth analysis detailing your home's value as well as a comparison with similar homes in the area
Home Values in the Area
Average Home Value in this Area
Purchase History
| Date | Buyer | Sale Price | Title Company |
|---|---|---|---|
| Mortazavi Amir | $760,000 | Resource Title Llc | |
| Cope Stephanie | -- | None Available | |
| Day Robert P | -- | None Available | |
| Day Marlyn C | -- | -- | |
| Day Marlyn C | $190,000 | -- | |
| -- | -- | -- | |
| -- | $65,000 | -- |
Source: Public Records
Mortgage History
| Date | Status | Borrower | Loan Amount |
|---|---|---|---|
| Previous Owner | Mortazavi Amir | $570,000 |
Source: Public Records
Tax History Compared to Growth
Tax History
| Year | Tax Paid | Tax Assessment Tax Assessment Total Assessment is a certain percentage of the fair market value that is determined by local assessors to be the total taxable value of land and additions on the property. | Land | Improvement |
|---|---|---|---|---|
| 2024 | $9,619 | $209,900 | $108,190 | $101,710 |
| 2023 | $9,499 | $209,895 | $108,185 | $101,710 |
| 2022 | $8,847 | $166,470 | $50,160 | $116,310 |
| 2021 | $8,862 | $166,470 | $50,160 | $116,310 |
| 2020 | $8,876 | $166,470 | $50,160 | $116,310 |
| 2019 | $9,019 | $145,040 | $43,610 | $101,430 |
| 2018 | $8,555 | $145,040 | $43,610 | $101,430 |
| 2017 | $9,017 | $145,040 | $43,610 | $101,430 |
| 2016 | $8,903 | $131,050 | $36,090 | $94,960 |
| 2015 | $8,106 | $131,050 | $36,090 | $94,960 |
| 2014 | $8,126 | $131,050 | $36,090 | $94,960 |
| 2013 | $3,817 | $124,810 | $34,370 | $90,440 |
Source: Public Records
Map
Nearby Homes
- 688 S 5th St
- 649 S 5th St
- 278 E Sycamore St
- 145 E Sycamore St
- 133 E Sycamore St
- 745 Mohawk St
- 307 E Sycamore St
- 279-281 E Beck St
- 606 Rader Alley
- 639 S Grant Ave
- 707 Sycamore Place Unit 707
- 783 Mohawk St
- 628 S Grant Ave
- 717 S 3rd St
- 318 Berger Alley
- 320 E Columbus St
- 616 S Grant Ave Unit 3B
- 300 Jackson St
- 161 Jackson St
- 46 E Frankfort St
- 221 E Sycamore St
- 203 E Sycamore St
- 227 E Sycamore St
- 698 S 5th St
- 201 E Sycamore St
- 214 E Sycamore St
- 231 E Sycamore St
- 199 E Sycamore St
- 220 E Sycamore St
- 210 E Sycamore St Unit 212
- 195 E Sycamore St
- 697 S 5th St
- 700 S 5th St
- 193 E Sycamore St
- 239 E Sycamore St
- 200 E Sycamore St
- 240 Alexander Alley
- 704 S 5th St
- 242 E Sycamore St
- 682 Macon Alley Unit 684