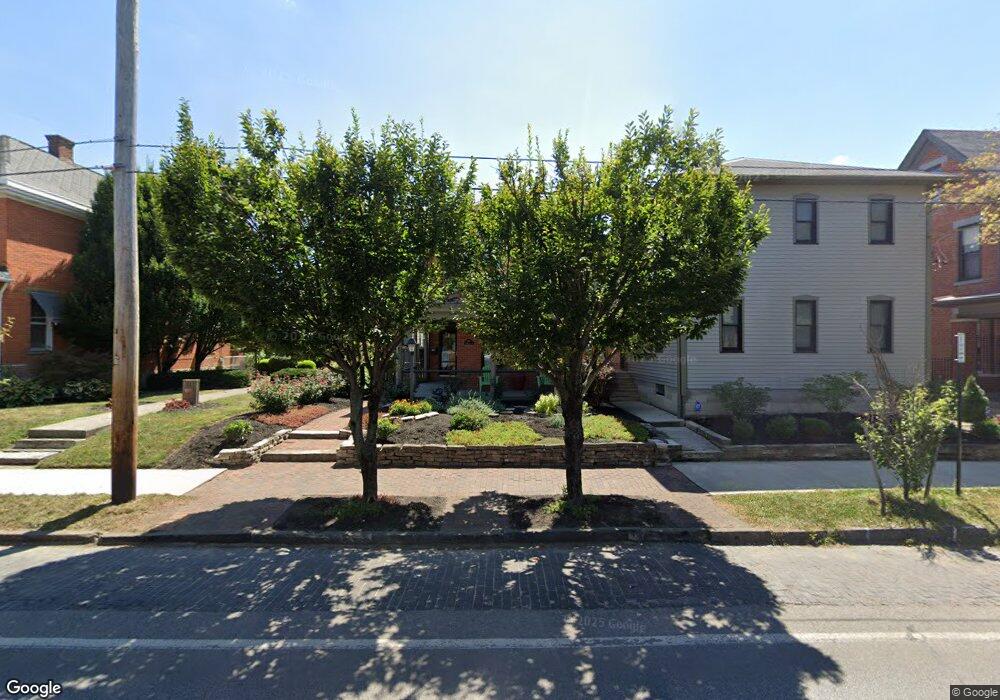
215 E Whittier St Columbus, OH 43206
German Village NeighborhoodEstimated Value: $756,639 - $937,000
2
Beds
3
Baths
1,960
Sq Ft
$426/Sq Ft
Est. Value
About This Home
This home is located at 215 E Whittier St, Columbus, OH 43206 and is currently estimated at $834,160, approximately $425 per square foot. 215 E Whittier St is a home located in Franklin County with nearby schools including Siebert Elementary School, South High School, and South Columbus Preparatory Academy.
Ownership History
Date
Name
Owned For
Owner Type
Purchase Details
Closed on
Mar 21, 2014
Sold by
Younger James D and Keeling John W
Bought by
Keeling John W
Current Estimated Value
Purchase Details
Closed on
Jun 15, 2007
Sold by
The Smithly Group Llc
Bought by
Younger Mary and Younger James
Home Financials for this Owner
Home Financials are based on the most recent Mortgage that was taken out on this home.
Original Mortgage
$353,600
Interest Rate
6.26%
Mortgage Type
Purchase Money Mortgage
Purchase Details
Closed on
Nov 30, 2005
Sold by
Wimer Ernest C and Wimer Carrie L
Bought by
The Smithly Group Llc
Purchase Details
Closed on
Jul 2, 1969
Bought by
Wimer Ernest C and Wimer Carrie L
Create a Home Valuation Report for This Property
The Home Valuation Report is an in-depth analysis detailing your home's value as well as a comparison with similar homes in the area
Home Values in the Area
Average Home Value in this Area
Purchase History
| Date | Buyer | Sale Price | Title Company |
|---|---|---|---|
| Keeling John W | -- | None Available | |
| Younger Mary | $442,000 | Connor Land | |
| The Smithly Group Llc | $185,000 | Amerititle | |
| Wimer Ernest C | -- | -- |
Source: Public Records
Mortgage History
| Date | Status | Borrower | Loan Amount |
|---|---|---|---|
| Previous Owner | Younger Mary | $353,600 |
Source: Public Records
Tax History Compared to Growth
Tax History
| Year | Tax Paid | Tax Assessment Tax Assessment Total Assessment is a certain percentage of the fair market value that is determined by local assessors to be the total taxable value of land and additions on the property. | Land | Improvement |
|---|---|---|---|---|
| 2024 | $9,833 | $228,900 | $108,010 | $120,890 |
| 2023 | $9,735 | $228,900 | $108,010 | $120,890 |
| 2022 | $9,196 | $186,060 | $45,290 | $140,770 |
| 2021 | $9,213 | $186,060 | $45,290 | $140,770 |
| 2020 | $9,224 | $186,060 | $45,290 | $140,770 |
| 2019 | $9,249 | $161,220 | $39,380 | $121,840 |
| 2018 | $8,800 | $161,220 | $39,380 | $121,840 |
| 2017 | $9,244 | $161,220 | $39,380 | $121,840 |
| 2016 | $9,221 | $147,950 | $32,380 | $115,570 |
| 2015 | $8,371 | $147,950 | $32,380 | $115,570 |
| 2014 | $8,391 | $147,950 | $32,380 | $115,570 |
| 2013 | $3,930 | $140,910 | $30,835 | $110,075 |
Source: Public Records
Map
Nearby Homes
- 243 E Whittier St Unit 245
- 136 E Whittier St
- 273 Reinhard Ave
- 783 Mohawk St
- 320 E Columbus St
- 745 Mohawk St
- 842 S Pearl St
- 37 Stewart Ave
- 718 S 6th St
- 1023 City Park Ave
- 874 S High St
- 781 Bruck St
- 688 S 5th St
- 717 S 3rd St
- 432 E Kossuth St
- 307 E Sycamore St
- 955 S High St
- 707 Sycamore Place Unit 707
- 33 E Frankfort St
- 46 E Frankfort St
- 209 E Whittier St Unit 213
- 217 E Whittier St Unit 219
- 209-213 E Whittier St
- 207 E Whittier St
- 221 E Whittier St Unit 223
- 221-223 E Whittier St
- 201 E Whittier St
- 223 E Whittier St
- 225 E Whittier St
- 227 E Whittier St
- 198 Concord Place
- 199 E Whittier St
- 239 E Whittier St Unit 239 E Whittier
- 193 E Whittier St Unit 2nd floor flat
- 193 E Whittier St
- 885 S 5th St
- 216 E Whittier St
- 212 Reinhard Ave
- 241 E Whittier St
- 220 Reinhard Ave