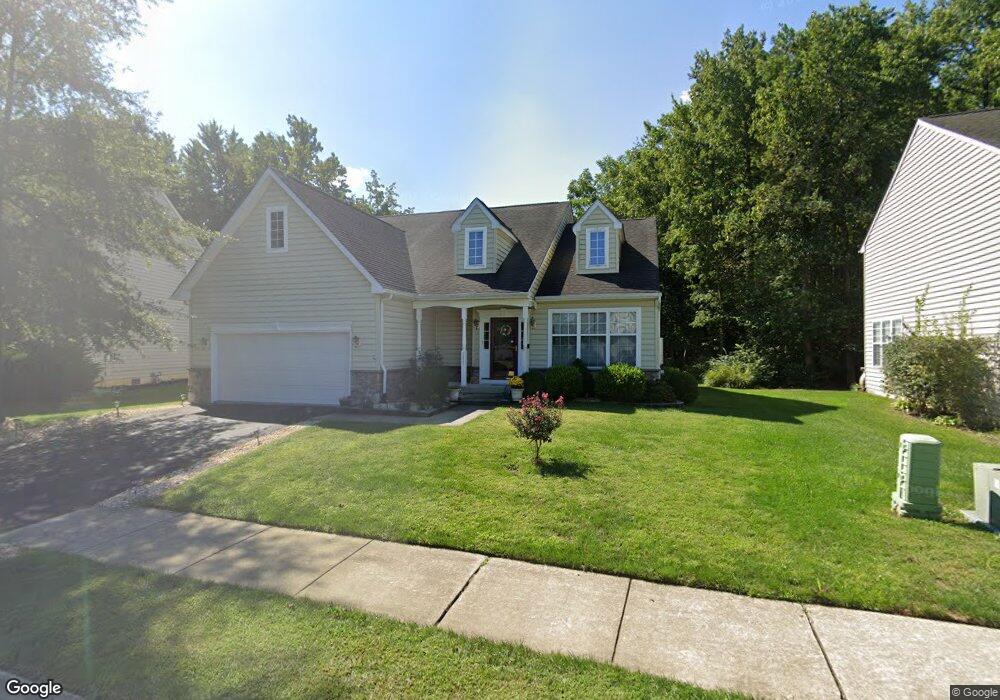
215 Foxglove Loop Bear, DE 19701
Kirkwood NeighborhoodEstimated Value: $518,000 - $608,000
3
Beds
3
Baths
2,873
Sq Ft
$195/Sq Ft
Est. Value
About This Home
This home is located at 215 Foxglove Loop, Bear, DE 19701 and is currently estimated at $561,332, approximately $195 per square foot. 215 Foxglove Loop is a home located in New Castle County with nearby schools including Kathleen H. Wilbur Elementary School, Gunning Bedford Middle School, and Red Lion Christian Academy.
Ownership History
Date
Name
Owned For
Owner Type
Purchase Details
Closed on
Jun 7, 2019
Sold by
Sinha Dinesh P
Bought by
Sinha Dinesh P
Current Estimated Value
Home Financials for this Owner
Home Financials are based on the most recent Mortgage that was taken out on this home.
Original Mortgage
$255,000
Outstanding Balance
$195,871
Interest Rate
4%
Mortgage Type
New Conventional
Estimated Equity
$365,461
Purchase Details
Closed on
Jul 31, 2012
Sold by
Sinha Dinesh P and Sinha Urmila
Bought by
Sinha Dinesh P and Sinha Urmila
Purchase Details
Closed on
Oct 24, 2008
Sold by
Benchmark Builders Inc
Bought by
Sinha Dinesh P and Sinha Urmila
Home Financials for this Owner
Home Financials are based on the most recent Mortgage that was taken out on this home.
Original Mortgage
$308,100
Interest Rate
5.94%
Mortgage Type
Purchase Money Mortgage
Purchase Details
Closed on
Feb 9, 2004
Sold by
Saienni William and The William Saienni Sr Revocab
Bought by
Benchmark Builders Inc
Create a Home Valuation Report for This Property
The Home Valuation Report is an in-depth analysis detailing your home's value as well as a comparison with similar homes in the area
Home Values in the Area
Average Home Value in this Area
Purchase History
| Date | Buyer | Sale Price | Title Company |
|---|---|---|---|
| Sinha Dinesh P | -- | Nationallink | |
| Sinha Dinesh P | -- | None Available | |
| Sinha Dinesh P | $385,153 | None Available | |
| Benchmark Builders Inc | $1,687,500 | -- |
Source: Public Records
Mortgage History
| Date | Status | Borrower | Loan Amount |
|---|---|---|---|
| Open | Sinha Dinesh P | $255,000 | |
| Previous Owner | Sinha Dinesh P | $308,100 |
Source: Public Records
Tax History
| Year | Tax Paid | Tax Assessment Tax Assessment Total Assessment is a certain percentage of the fair market value that is determined by local assessors to be the total taxable value of land and additions on the property. | Land | Improvement |
|---|---|---|---|---|
| 2024 | $3,659 | $119,600 | $11,700 | $107,900 |
| 2023 | $3,302 | $119,600 | $11,700 | $107,900 |
| 2022 | $3,459 | $119,600 | $11,700 | $107,900 |
| 2021 | $3,557 | $119,600 | $11,700 | $107,900 |
| 2020 | $3,583 | $119,600 | $11,700 | $107,900 |
| 2019 | $3,717 | $119,600 | $11,700 | $107,900 |
| 2018 | $3,518 | $119,600 | $11,700 | $107,900 |
| 2017 | $3,271 | $119,600 | $11,700 | $107,900 |
| 2016 | $2,772 | $119,600 | $11,700 | $107,900 |
| 2015 | $2,772 | $119,600 | $11,700 | $107,900 |
| 2014 | $2,790 | $119,600 | $11,700 | $107,900 |
Source: Public Records
Map
Nearby Homes
- 1962 Old Kirkwood Rd
- 425 E Red Lion Dr
- 622 Clifton Dr
- 616 Clifton Dr
- 3213 Wrangle Hill Rd
- 3211 Wrangle Hill Rd
- 3209 Wrangle Hill Rd
- 8 Bell St Unit A068
- 479 Granger Dr
- 465 Granger Dr
- 235 Cheyenne Dr
- 523 Ponderosa Dr
- 918 Decoy Way Unit 171
- 715 Javelin Way Unit 71
- 45 Longleaf Ln
- 235 Hope Ct W
- 688 Corsica Ave
- 250 Palermo Dr
- 221 Vercelli Dr
- 325 Howell School Rd
- 217 Foxglove Loop
- 213 Foxglove Loop
- 219 Foxglove Loop
- 210 Foxglove Loop
- 1839 Red Lion Rd
- 211 Foxglove Loop
- 216 Foxglove Loop
- 220 Foxglove Loop
- 221 Foxglove Loop
- 209 Foxglove Loop
- 208 Foxglove Loop
- 224 Foxglove Loop
- 223 Foxglove Loop
- 207 Foxglove Loop
- 206 Foxglove Loop
- 226 Foxglove Loop
- 225 Foxglove Loop
- 205 Foxglove Loop
- 204 Foxglove Loop
- 105 Willow Oak Blvd
Your Personal Tour Guide
Ask me questions while you tour the home.