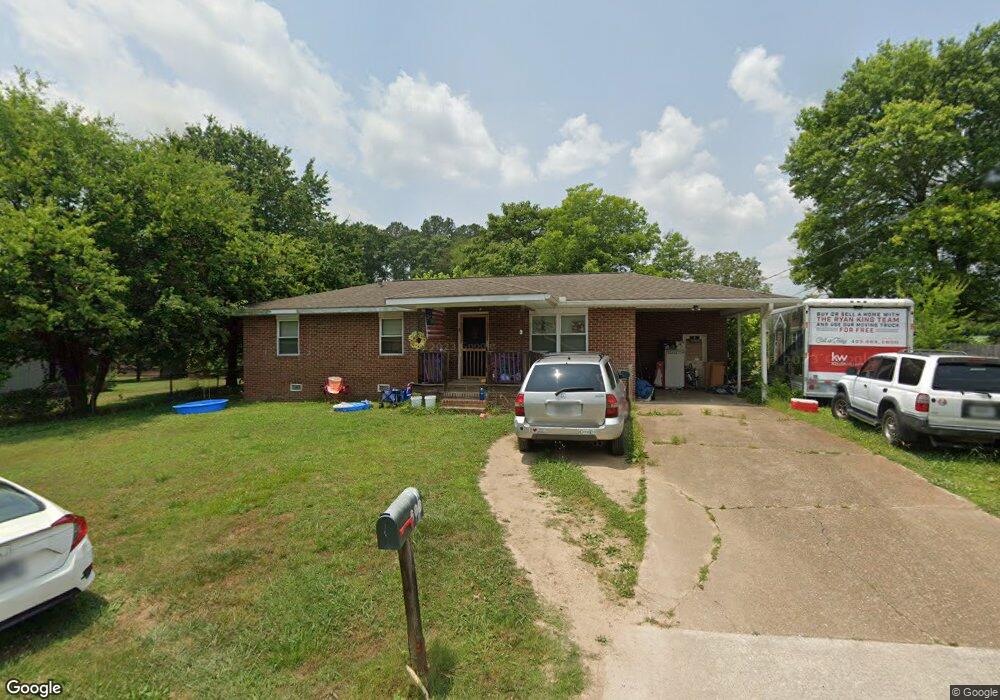
215 Ginger Ln Chickamauga, GA 30707
Estimated Value: $159,169 - $204,000
--
Bed
2
Baths
1,056
Sq Ft
$175/Sq Ft
Est. Value
About This Home
This home is located at 215 Ginger Ln, Chickamauga, GA 30707 and is currently estimated at $184,542, approximately $174 per square foot. 215 Ginger Ln is a home located in Walker County with nearby schools including Chickamauga Elementary School, Gordon Lee Middle School, and Gordon Lee High School.
Ownership History
Date
Name
Owned For
Owner Type
Purchase Details
Closed on
Mar 1, 2010
Sold by
Gordy Tommy
Bought by
Kellogg Tommie Ann
Current Estimated Value
Purchase Details
Closed on
Jun 5, 1984
Sold by
Jarnagin Ralph L and Jarnagin Sharon
Bought by
Gordy Tommy and Gordy Virginia
Purchase Details
Closed on
May 5, 1978
Sold by
Murray Claude
Bought by
Jarnagin Ralph L and Jarnagin Sharon
Purchase Details
Closed on
Jan 1, 1972
Bought by
Murray Claude
Create a Home Valuation Report for This Property
The Home Valuation Report is an in-depth analysis detailing your home's value as well as a comparison with similar homes in the area
Home Values in the Area
Average Home Value in this Area
Purchase History
| Date | Buyer | Sale Price | Title Company |
|---|---|---|---|
| Kellogg Tommie Ann | -- | -- | |
| Gordy Tommy | -- | -- | |
| Jarnagin Ralph L | -- | -- | |
| Murray Claude | -- | -- |
Source: Public Records
Tax History Compared to Growth
Tax History
| Year | Tax Paid | Tax Assessment Tax Assessment Total Assessment is a certain percentage of the fair market value that is determined by local assessors to be the total taxable value of land and additions on the property. | Land | Improvement |
|---|---|---|---|---|
| 2024 | $1,335 | $57,113 | $6,000 | $51,113 |
| 2023 | $1,310 | $54,360 | $6,000 | $48,360 |
| 2022 | $556 | $47,317 | $6,000 | $41,317 |
| 2021 | $468 | $32,238 | $6,000 | $26,238 |
| 2020 | $447 | $27,669 | $6,000 | $21,669 |
| 2019 | $446 | $27,669 | $6,000 | $21,669 |
| 2018 | $363 | $27,669 | $6,000 | $21,669 |
| 2017 | $363 | $27,669 | $6,000 | $21,669 |
| 2016 | $411 | $27,669 | $6,000 | $21,669 |
| 2015 | $466 | $31,147 | $6,000 | $25,147 |
| 2014 | $370 | $31,147 | $6,000 | $25,147 |
| 2013 | -- | $31,147 | $6,000 | $25,147 |
Source: Public Records
Map
Nearby Homes
- 206 Wheeler Ave
- 205 Wheeler Ave
- 0 Pearl Ave Unit 1523358
- 138 Dana Ln
- 54 Mill Springs
- 301 Clebourne Ave
- 378 Sentry Oaks
- 74 Lail Rd
- 111 Clebourne Ave
- 52 Stones River Dr
- 801 Thomas Ave
- 0 Bear Paw Trail Unit 1519259
- 0 Bear Paw Trail Unit RTC2980469
- 503 Sentry Oaks
- 305 Gordon St
- 17 W Fork Ln
- 201 E Tennant Cir
- 74 Cove Rd
- 80 Cove Rd
- 130 Krystal Dr
- 217 Ginger Ln
- 213 Ginger Ln
- 218 Wheeler Ave
- 216 Ginger Ln
- 216 Wheeler Ave
- 220 Wheeler Ave
- 218 Ginger Ln
- 219 Ginger Ln
- 222 Wheeler Ave
- 220 Ginger Ln
- 214 Wheeler Ave
- 215 Walthall Ave
- 217 Walthall Ave
- 221 Ginger Ln
- 209 Walthall Ave
- 212 Wheeler Ave
- 224 Wheeler Ave
- 222 Ginger Ln
- 219 Walthall Ave
- 221 Walthall Ave