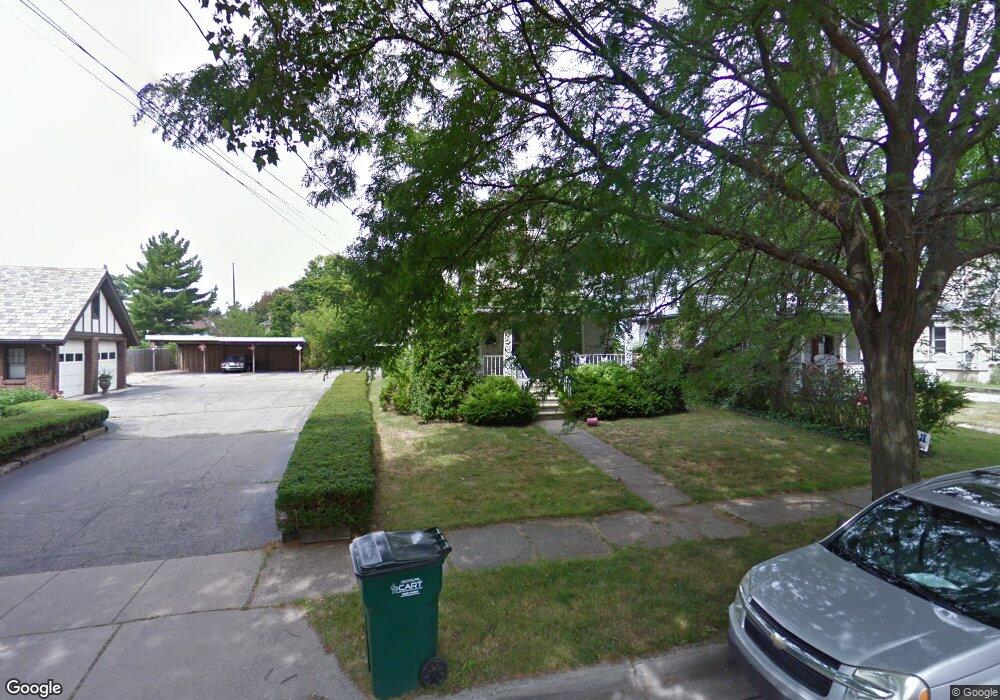
215 Horton St Lansing, MI 48912
Eastfield NeighborhoodEstimated Value: $199,000 - $222,000
4
Beds
3
Baths
2,742
Sq Ft
$77/Sq Ft
Est. Value
About This Home
This home is located at 215 Horton St, Lansing, MI 48912 and is currently estimated at $210,123, approximately $76 per square foot. 215 Horton St is a home located in Ingham County with nearby schools including Pattengill Academy, Riddle Elementary School, and Eastern High School.
Ownership History
Date
Name
Owned For
Owner Type
Purchase Details
Closed on
Apr 2, 2007
Sold by
Bannasch Investment Inc
Bought by
Pennock Ryan P and Pennock Luz Garcia
Current Estimated Value
Home Financials for this Owner
Home Financials are based on the most recent Mortgage that was taken out on this home.
Original Mortgage
$26,980
Interest Rate
6.2%
Mortgage Type
Stand Alone Second
Purchase Details
Closed on
Sep 17, 1992
Sold by
Bannasch Harry J and Bannasch Elaine
Bought by
Bannasch Elaine M
Create a Home Valuation Report for This Property
The Home Valuation Report is an in-depth analysis detailing your home's value as well as a comparison with similar homes in the area
Home Values in the Area
Average Home Value in this Area
Purchase History
| Date | Buyer | Sale Price | Title Company |
|---|---|---|---|
| Pennock Ryan P | $134,900 | None Available | |
| Bannasch Elaine M | -- | -- |
Source: Public Records
Mortgage History
| Date | Status | Borrower | Loan Amount |
|---|---|---|---|
| Closed | Pennock Ryan P | $26,980 | |
| Open | Pennock Ryan P | $107,920 |
Source: Public Records
Tax History Compared to Growth
Tax History
| Year | Tax Paid | Tax Assessment Tax Assessment Total Assessment is a certain percentage of the fair market value that is determined by local assessors to be the total taxable value of land and additions on the property. | Land | Improvement |
|---|---|---|---|---|
| 2025 | $5,293 | $107,100 | $11,200 | $95,900 |
| 2024 | $44 | $93,100 | $11,200 | $81,900 |
| 2023 | $4,982 | $85,300 | $11,200 | $74,100 |
| 2022 | $4,551 | $79,600 | $9,600 | $70,000 |
| 2021 | $4,445 | $73,600 | $8,000 | $65,600 |
| 2020 | $4,414 | $70,200 | $8,000 | $62,200 |
| 2019 | $4,263 | $64,600 | $8,000 | $56,600 |
| 2018 | $4,043 | $57,800 | $8,000 | $49,800 |
| 2017 | $3,891 | $57,800 | $8,000 | $49,800 |
| 2016 | $3,750 | $52,300 | $8,000 | $44,300 |
| 2015 | $3,750 | $50,100 | $16,028 | $34,072 |
| 2014 | $3,750 | $49,500 | $14,745 | $34,755 |
Source: Public Records
Map
Nearby Homes
- 413 N Clemens Ave
- 222 S Clemens Ave
- 207 Allen St
- 435 N Magnolia Ave
- 129 Clifford St
- 322 N Foster Ave
- 329 S Clemens Ave
- 138 S Francis Ave
- 417 N Francis Ave
- 125 Ferguson St
- 424 S Clemens Ave
- 129 S Francis Ave
- 133 S Francis Ave
- 135 S Francis Ave
- 1346 Eureka St
- 623 N Hayford Ave
- 404 S Hayford Ave
- 1316 Jerome St
- 118 Mifflin Ave
- 412 S Hayford Ave