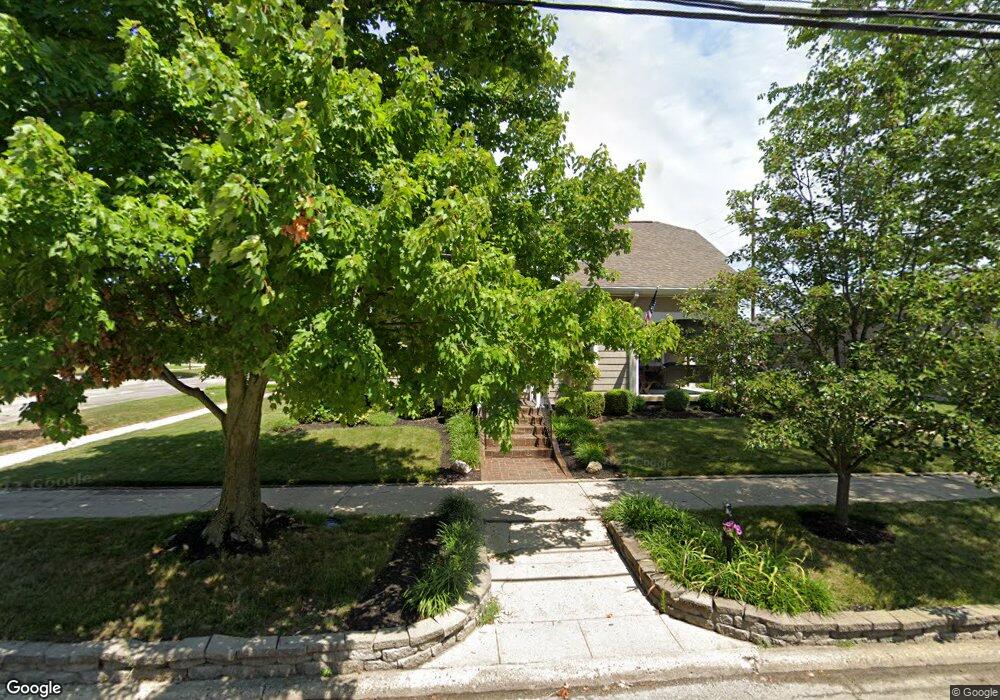
215 N 6th St Marshall, IL 62441
Estimated Value: $95,000 - $132,000
--
Bed
--
Bath
1,091
Sq Ft
$103/Sq Ft
Est. Value
About This Home
This home is located at 215 N 6th St, Marshall, IL 62441 and is currently estimated at $112,457, approximately $103 per square foot. 215 N 6th St is a home located in Clark County with nearby schools including South Elementary School, North Elementary School, and Marshall Junior High School.
Ownership History
Date
Name
Owned For
Owner Type
Purchase Details
Closed on
Jan 20, 2022
Sold by
White James E and White Alane C
Bought by
Garling Kristin M
Current Estimated Value
Home Financials for this Owner
Home Financials are based on the most recent Mortgage that was taken out on this home.
Original Mortgage
$1
Outstanding Balance
$1
Interest Rate
3.75%
Mortgage Type
New Conventional
Purchase Details
Closed on
Jul 21, 2008
Sold by
Weaver Robert A and Estate Of Geneva J Murphy
Bought by
White James E and White Alane White
Create a Home Valuation Report for This Property
The Home Valuation Report is an in-depth analysis detailing your home's value as well as a comparison with similar homes in the area
Home Values in the Area
Average Home Value in this Area
Purchase History
| Date | Buyer | Sale Price | Title Company |
|---|---|---|---|
| Garling Kristin M | $93,000 | Shoaff Law Llc | |
| White James E | $50,000 | None Available |
Source: Public Records
Mortgage History
| Date | Status | Borrower | Loan Amount |
|---|---|---|---|
| Open | Garling Kristin M | $1 |
Source: Public Records
Tax History Compared to Growth
Tax History
| Year | Tax Paid | Tax Assessment Tax Assessment Total Assessment is a certain percentage of the fair market value that is determined by local assessors to be the total taxable value of land and additions on the property. | Land | Improvement |
|---|---|---|---|---|
| 2024 | $1,742 | $26,898 | $4,422 | $22,476 |
| 2023 | $1,719 | $26,898 | $4,422 | $22,476 |
| 2022 | $1,657 | $24,016 | $3,948 | $20,068 |
| 2021 | $1,668 | $22,445 | $3,690 | $18,755 |
| 2020 | $1,667 | $22,445 | $3,690 | $18,755 |
| 2019 | $1,667 | $22,445 | $3,690 | $18,755 |
| 2018 | $1,708 | $22,445 | $3,690 | $18,755 |
| 2017 | $1,728 | $22,955 | $3,774 | $19,181 |
| 2016 | $1,783 | $22,445 | $3,690 | $18,755 |
| 2015 | $1,660 | $21,334 | $2,188 | $19,146 |
| 2014 | $1,590 | $20,765 | $2,130 | $18,635 |
| 2013 | $1,590 | $20,065 | $2,060 | $18,005 |
Source: Public Records
Map
Nearby Homes