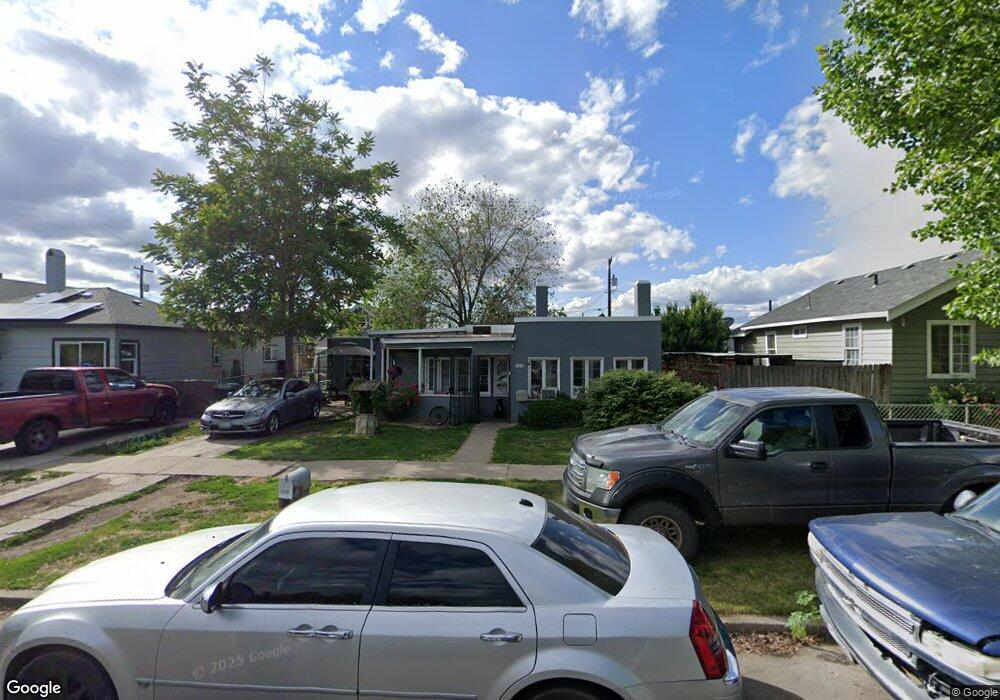
215 Pearne St Toppenish, WA 98948
Estimated Value: $231,000 - $295,000
3
Beds
2
Baths
1,484
Sq Ft
$178/Sq Ft
Est. Value
About This Home
This home is located at 215 Pearne St, Toppenish, WA 98948 and is currently estimated at $264,763, approximately $178 per square foot. 215 Pearne St is a home located in Yakima County with nearby schools including Toppenish High School.
Ownership History
Date
Name
Owned For
Owner Type
Purchase Details
Closed on
Dec 1, 2005
Sold by
Patrick Terry E and Patrick Mary M
Bought by
Peters Lucille E and Rodriguez Susan A
Current Estimated Value
Purchase Details
Closed on
Mar 18, 2004
Sold by
Peter Lucille E
Bought by
Rodriguez Susan A
Purchase Details
Closed on
Sep 9, 2003
Sold by
Patrick Terry E and Patrick Mary M
Bought by
Peters Lucille E and Rodriguez Susan A
Purchase Details
Closed on
Sep 5, 2003
Sold by
Huylar Lorraine Julia
Bought by
Patrick Terry E and Patrick Mary M
Create a Home Valuation Report for This Property
The Home Valuation Report is an in-depth analysis detailing your home's value as well as a comparison with similar homes in the area
Home Values in the Area
Average Home Value in this Area
Purchase History
| Date | Buyer | Sale Price | Title Company |
|---|---|---|---|
| Peters Lucille E | $70,000 | Pacific Alliance Title Co | |
| Rodriguez Susan A | -- | -- | |
| Peters Lucille E | $70,000 | Schreiner Title Company | |
| Patrick Terry E | -- | Schreiner Title Company |
Source: Public Records
Mortgage History
| Date | Status | Borrower | Loan Amount |
|---|---|---|---|
| Closed | Peters Lucille E | $0 |
Source: Public Records
Tax History Compared to Growth
Tax History
| Year | Tax Paid | Tax Assessment Tax Assessment Total Assessment is a certain percentage of the fair market value that is determined by local assessors to be the total taxable value of land and additions on the property. | Land | Improvement |
|---|---|---|---|---|
| 2025 | $5,789 | $182,300 | $26,500 | $155,800 |
| 2023 | $1,712 | $131,900 | $32,200 | $99,700 |
| 2022 | $1,233 | $109,400 | $30,000 | $79,400 |
| 2021 | $1,382 | $98,800 | $27,000 | $71,800 |
| 2019 | $1,071 | $91,800 | $25,800 | $66,000 |
| 2018 | $922 | $78,500 | $24,800 | $53,700 |
| 2017 | $2,413 | $80,200 | $24,800 | $55,400 |
| 2016 | $975 | $81,550 | $24,750 | $56,800 |
| 2015 | $975 | $80,450 | $24,750 | $55,700 |
| 2014 | $975 | $80,450 | $24,750 | $55,700 |
| 2013 | $975 | $80,450 | $24,750 | $55,700 |
Source: Public Records
Map
Nearby Homes