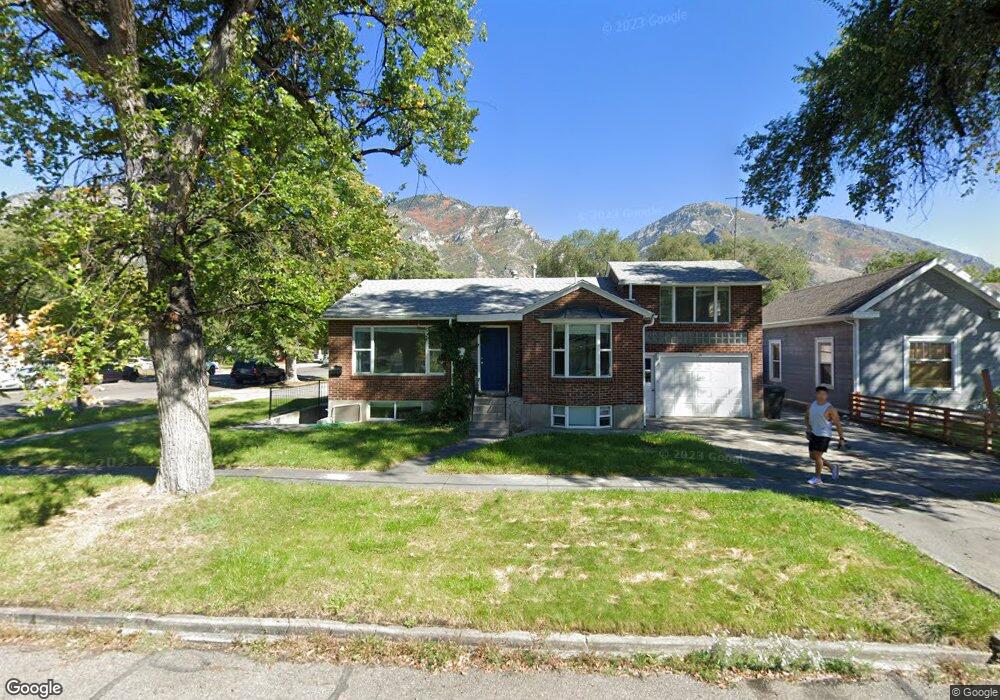
215 S 500 E Unit 2 Provo, UT 84606
Joaquin NeighborhoodEstimated Value: $489,000 - $524,000
5
Beds
2
Baths
2,072
Sq Ft
$245/Sq Ft
Est. Value
About This Home
This home is located at 215 S 500 E Unit 2, Provo, UT 84606 and is currently estimated at $508,316, approximately $245 per square foot. 215 S 500 E Unit 2 is a home located in Utah County with nearby schools including Provo Peaks School, Centennial Middle School, and Timpview High School.
Ownership History
Date
Name
Owned For
Owner Type
Purchase Details
Closed on
Apr 8, 2014
Sold by
Donaldson Matthew L
Bought by
Donaldson Matthew L
Current Estimated Value
Home Financials for this Owner
Home Financials are based on the most recent Mortgage that was taken out on this home.
Original Mortgage
$157,500
Outstanding Balance
$119,639
Interest Rate
4.32%
Mortgage Type
Commercial
Estimated Equity
$388,677
Purchase Details
Closed on
Jan 4, 2010
Sold by
Beeton Russ
Bought by
Donaldson Matthew L
Purchase Details
Closed on
Nov 11, 2009
Sold by
Burgess Maria A and Mortgage Electronic Registrati
Bought by
Beeton Russ
Purchase Details
Closed on
May 12, 1998
Sold by
Chatterley Terrilyn J and Carter Terrilyn Strong
Bought by
Chatterley Steven C and Chatterley Terrilyn J
Home Financials for this Owner
Home Financials are based on the most recent Mortgage that was taken out on this home.
Original Mortgage
$84,400
Interest Rate
7.13%
Mortgage Type
Commercial
Create a Home Valuation Report for This Property
The Home Valuation Report is an in-depth analysis detailing your home's value as well as a comparison with similar homes in the area
Home Values in the Area
Average Home Value in this Area
Purchase History
| Date | Buyer | Sale Price | Title Company |
|---|---|---|---|
| Donaldson Matthew L | -- | Provo Land Title Co | |
| Donaldson Matthew L | -- | Provo Land Title Company | |
| Beeton Russ | -- | Us Title Insurance Agency | |
| Chatterley Steven C | -- | First American Title |
Source: Public Records
Mortgage History
| Date | Status | Borrower | Loan Amount |
|---|---|---|---|
| Open | Donaldson Matthew L | $157,500 | |
| Previous Owner | Chatterley Steven C | $84,400 |
Source: Public Records
Tax History
| Year | Tax Paid | Tax Assessment Tax Assessment Total Assessment is a certain percentage of the fair market value that is determined by local assessors to be the total taxable value of land and additions on the property. | Land | Improvement |
|---|---|---|---|---|
| 2025 | $2,791 | $264,385 | -- | -- |
| 2024 | $2,791 | $274,780 | $0 | $0 |
| 2023 | $2,804 | $272,085 | $0 | $0 |
| 2022 | $2,648 | $259,105 | $0 | $0 |
| 2021 | $2,209 | $376,900 | $131,900 | $245,000 |
| 2020 | $2,104 | $336,600 | $117,800 | $218,800 |
| 2019 | $1,882 | $313,100 | $113,500 | $199,600 |
| 2018 | $1,628 | $274,700 | $149,000 | $125,700 |
| 2017 | $1,468 | $136,070 | $0 | $0 |
| 2016 | $1,326 | $114,565 | $0 | $0 |
| 2015 | $1,193 | $104,170 | $0 | $0 |
| 2014 | $995 | $90,585 | $0 | $0 |
Source: Public Records
Map
Nearby Homes
Your Personal Tour Guide
Ask me questions while you tour the home.