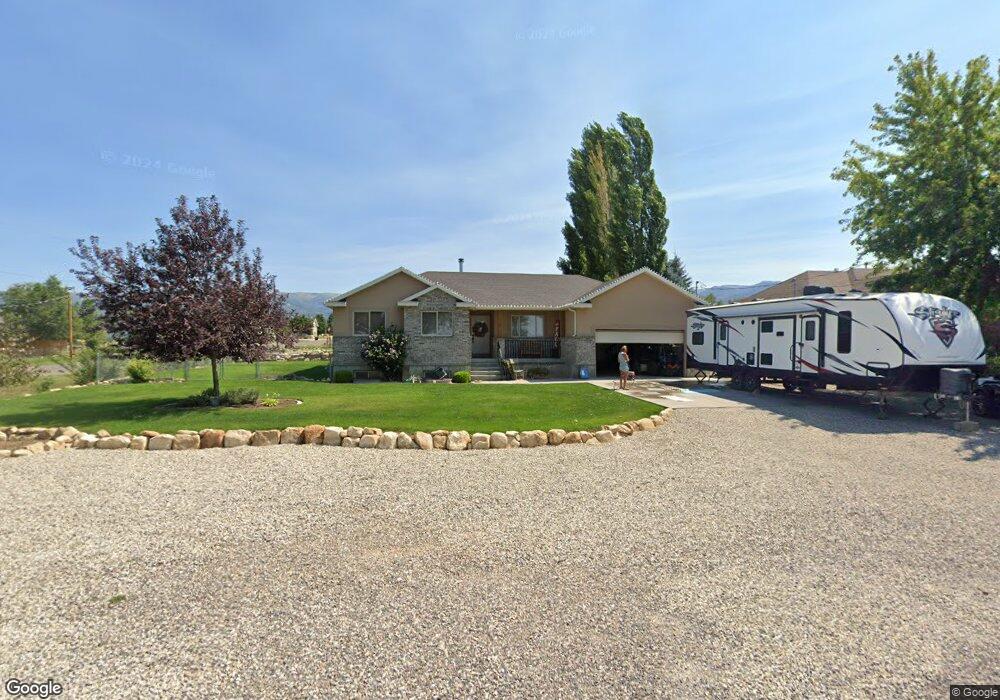
215 S 600 E Mount Pleasant, UT 84647
Estimated Value: $496,000 - $534,000
6
Beds
3
Baths
3,000
Sq Ft
$173/Sq Ft
Est. Value
About This Home
This home is located at 215 S 600 E, Mount Pleasant, UT 84647 and is currently estimated at $517,741, approximately $172 per square foot. 215 S 600 E is a home located in Sanpete County with nearby schools including North Sanpete High School and Wasatch Academy.
Ownership History
Date
Name
Owned For
Owner Type
Purchase Details
Closed on
Jun 13, 2018
Sold by
Kelso Luke A and Kelso Jerry L
Bought by
Ford Kory Robert
Current Estimated Value
Purchase Details
Closed on
Nov 10, 2011
Sold by
Secretary Of Housing And Urban Developme
Bought by
Parker David
Purchase Details
Closed on
Aug 5, 2011
Sold by
Jpmorgan Chase Bank National Association
Bought by
Secretary Of Housing And Urban Developme
Purchase Details
Closed on
Feb 12, 2008
Sold by
Skyline Development Group Llc
Bought by
Cunningham Robert
Purchase Details
Closed on
Dec 7, 2006
Sold by
Goble Rick and Goble Stacey
Bought by
Blackham Jed
Create a Home Valuation Report for This Property
The Home Valuation Report is an in-depth analysis detailing your home's value as well as a comparison with similar homes in the area
Home Values in the Area
Average Home Value in this Area
Purchase History
| Date | Buyer | Sale Price | Title Company |
|---|---|---|---|
| Ford Kory Robert | -- | 1St American | |
| Parker David | -- | -- | |
| Secretary Of Housing And Urban Developme | -- | -- | |
| Cunningham Robert | -- | -- | |
| Blackham Jed | -- | -- |
Source: Public Records
Tax History
| Year | Tax Paid | Tax Assessment Tax Assessment Total Assessment is a certain percentage of the fair market value that is determined by local assessors to be the total taxable value of land and additions on the property. | Land | Improvement |
|---|---|---|---|---|
| 2025 | $2,364 | $267,132 | $0 | $0 |
| 2024 | $2,402 | $255,912 | $0 | $0 |
| 2023 | $2,344 | $240,293 | $0 | $0 |
| 2022 | $2,346 | $214,548 | $0 | $0 |
| 2021 | $2,067 | $171,511 | $0 | $0 |
| 2020 | $1,942 | $146,849 | $0 | $0 |
| 2019 | $1,913 | $136,199 | $0 | $0 |
| 2018 | $1,755 | $215,335 | $22,677 | $192,658 |
| 2017 | $1,657 | $113,388 | $0 | $0 |
| 2016 | $1,303 | $89,175 | $0 | $0 |
| 2015 | $1,312 | $89,175 | $0 | $0 |
| 2014 | $1,339 | $89,175 | $0 | $0 |
| 2013 | $1,259 | $89,175 | $0 | $0 |
Source: Public Records
Map
Nearby Homes
Your Personal Tour Guide
Ask me questions while you tour the home.