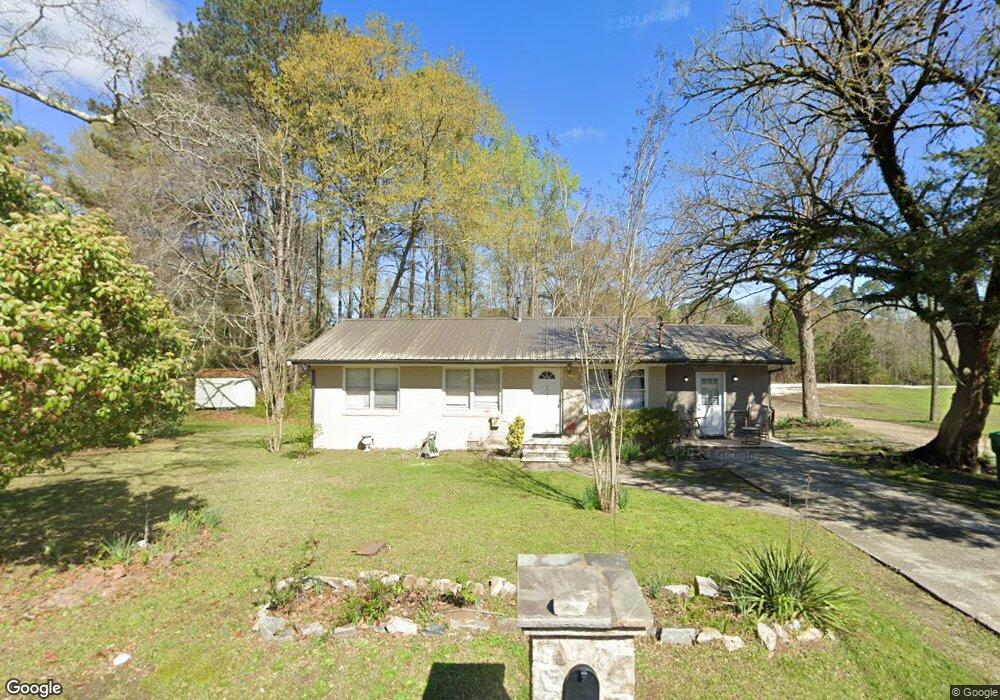
215 S Rhodes St Union Point, GA 30669
Estimated Value: $119,321 - $165,000
3
Beds
1
Bath
988
Sq Ft
$142/Sq Ft
Est. Value
About This Home
This home is located at 215 S Rhodes St, Union Point, GA 30669 and is currently estimated at $139,830, approximately $141 per square foot. 215 S Rhodes St is a home located in Greene County with nearby schools including Greene County High School.
Ownership History
Date
Name
Owned For
Owner Type
Purchase Details
Closed on
Oct 31, 2024
Sold by
Perez Jair Chavez
Bought by
Cruz Juan Carlos
Current Estimated Value
Purchase Details
Closed on
Oct 20, 2022
Sold by
Titan Equities Llc
Bought by
Perez Jair Chavez
Purchase Details
Closed on
Jan 27, 2017
Bought by
Titan Equities Llc
Purchase Details
Closed on
Sep 19, 2016
Sold by
Dorothy T
Bought by
Wells Fargo Bank National Asso
Purchase Details
Closed on
Oct 2, 2000
Sold by
Heath Dorothy T
Bought by
Cummings Dorothy T and Cummings John
Purchase Details
Closed on
Nov 27, 1990
Sold by
Fha
Bought by
Heath Dorothy T
Purchase Details
Closed on
Nov 22, 1989
Sold by
Scott Milton
Bought by
Fha
Purchase Details
Closed on
Jan 1, 1985
Sold by
Fha
Bought by
Scott Milton
Purchase Details
Closed on
Jan 1, 1981
Sold by
Fha
Bought by
White Johnnie M
Purchase Details
Closed on
Jan 1, 1980
Sold by
Brightwell Harold and Brightwell Slorene M
Bought by
Fha
Purchase Details
Closed on
Jan 1, 1971
Sold by
Harrison James E and Harrison Rober G
Bought by
Brightwell Harold and Brightwell Slorene M
Purchase Details
Closed on
Jan 1, 1950
Sold by
Turner L M
Bought by
Turner L M
Purchase Details
Closed on
Jan 1, 1943
Bought by
Turner L M
Create a Home Valuation Report for This Property
The Home Valuation Report is an in-depth analysis detailing your home's value as well as a comparison with similar homes in the area
Home Values in the Area
Average Home Value in this Area
Purchase History
| Date | Buyer | Sale Price | Title Company |
|---|---|---|---|
| Cruz Juan Carlos | -- | -- | |
| Perez Jair Chavez | $44,410 | -- | |
| Titan Equities Llc | $19,109 | -- | |
| Wells Fargo Bank National Asso | -- | -- | |
| Cummings Dorothy T | -- | -- | |
| Heath Dorothy T | -- | -- | |
| Fha | -- | -- | |
| Scott Milton | -- | -- | |
| Fha | -- | -- | |
| White Johnnie M | -- | -- | |
| Fha | -- | -- | |
| Brightwell Harold | -- | -- | |
| Harrison James E | -- | -- | |
| Turner L M | -- | -- | |
| Turner L M | -- | -- |
Source: Public Records
Tax History Compared to Growth
Tax History
| Year | Tax Paid | Tax Assessment Tax Assessment Total Assessment is a certain percentage of the fair market value that is determined by local assessors to be the total taxable value of land and additions on the property. | Land | Improvement |
|---|---|---|---|---|
| 2024 | $1,253 | $46,400 | $2,440 | $43,960 |
| 2023 | $895 | $43,760 | $2,440 | $41,320 |
| 2022 | $427 | $14,600 | $2,199 | $12,401 |
| 2021 | $501 | $21,440 | $2,440 | $19,000 |
| 2020 | $393 | $11,320 | $2,680 | $8,640 |
| 2019 | $403 | $11,320 | $2,680 | $8,640 |
| 2018 | $188 | $11,320 | $2,680 | $8,640 |
| 2017 | $328 | $11,345 | $2,700 | $8,645 |
| 2016 | $331 | $11,576 | $2,700 | $8,876 |
| 2015 | $301 | $11,576 | $2,700 | $8,876 |
| 2014 | $306 | $11,577 | $2,700 | $8,877 |
Source: Public Records
Map
Nearby Homes
- 0 S Rhodes St Unit 10618488
- 0 Washington Hwy Unit 7276060
- 215 Hunter St
- 324 N Rhodes St
- 202 Veazey St
- 606 Bryan Ave
- 1241 Old Siloam Rd
- 1180 Moody St
- 504 Crawfordville Rd
- 1010 Orear Rd
- 1041 Hillcrest Dr
- 0 Woodland Ct Unit 1027434
- 0 Woodland Ct Unit 10543600
- 1860 Washington Hwy
- 1251 Adams Rd
- 0 Buffalo Lick Rd Unit 10551328
- 1201 Buffalo Lick Rd
- 0 Buffalo Lick Rd Unit 10551325
- 0 Buffalo Lick Rd Unit 10551234
- 0 Old Union Point Rd Unit 1 10557753
- 213 S Rhodes St
- 217 S Rhodes St
- 211 S Rhodes St
- 214 S Rhodes St
- 218 S Rhodes St
- 220 S Rhodes St
- 0 S Rhodes St Unit CM1004415
- 0 S Rhodes St Unit 65897
- 0 S Rhodes St Unit 10274358
- 0 S Rhodes St Unit 1015276
- 0 S Rhodes St Unit 10127181
- 0 S Rhodes St
- S S Rhodes St
- 301 S Rhodes St
- 212 S Rhodes St
- 206 Willow Ln
- 209 Willow Ln
- 303 S Rhodes St
- 210 S Rhodes St
- 1101 Alexander St