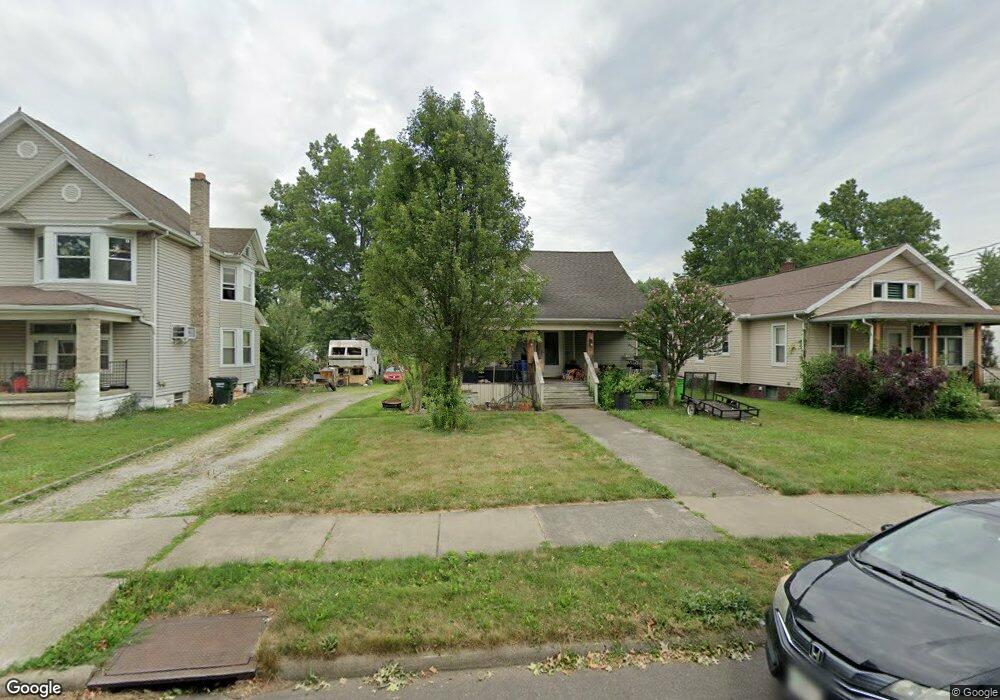
215 Selby St Alliance, OH 44601
Estimated Value: $84,000 - $123,227
3
Beds
2
Baths
1,086
Sq Ft
$96/Sq Ft
Est. Value
About This Home
This home is located at 215 Selby St, Alliance, OH 44601 and is currently estimated at $104,057, approximately $95 per square foot. 215 Selby St is a home located in Stark County with nearby schools including Alliance Early Learning School, Alliance Intermediate School at Northside, and Alliance Middle School.
Ownership History
Date
Name
Owned For
Owner Type
Purchase Details
Closed on
Jul 18, 2006
Sold by
Yost Gerard and Yost Melissa
Bought by
Yost Gerard and Yost Melissa
Current Estimated Value
Home Financials for this Owner
Home Financials are based on the most recent Mortgage that was taken out on this home.
Original Mortgage
$71,900
Outstanding Balance
$42,874
Interest Rate
6.73%
Mortgage Type
Stand Alone Refi Refinance Of Original Loan
Estimated Equity
$61,183
Purchase Details
Closed on
Mar 7, 2005
Sold by
Yost Kae K
Bought by
Yost Gerard
Home Financials for this Owner
Home Financials are based on the most recent Mortgage that was taken out on this home.
Original Mortgage
$76,500
Interest Rate
7.62%
Mortgage Type
Purchase Money Mortgage
Purchase Details
Closed on
Jul 28, 2004
Sold by
Yost Kae K and Yost Thomas
Bought by
Yost Gerard T and Yost Melissa A
Home Financials for this Owner
Home Financials are based on the most recent Mortgage that was taken out on this home.
Original Mortgage
$25,000
Interest Rate
6.34%
Mortgage Type
Seller Take Back
Purchase Details
Closed on
Aug 26, 1999
Sold by
Estate Of Anna Kathleen Hoover
Bought by
Yost Kae K
Create a Home Valuation Report for This Property
The Home Valuation Report is an in-depth analysis detailing your home's value as well as a comparison with similar homes in the area
Home Values in the Area
Average Home Value in this Area
Purchase History
| Date | Buyer | Sale Price | Title Company |
|---|---|---|---|
| Yost Gerard | -- | None Available | |
| Yost Gerard | $90,000 | -- | |
| Yost Gerard T | $25,000 | -- | |
| Yost Kae K | -- | -- |
Source: Public Records
Mortgage History
| Date | Status | Borrower | Loan Amount |
|---|---|---|---|
| Open | Yost Gerard | $71,900 | |
| Closed | Yost Gerard | $76,500 | |
| Closed | Yost Gerard T | $25,000 |
Source: Public Records
Tax History Compared to Growth
Tax History
| Year | Tax Paid | Tax Assessment Tax Assessment Total Assessment is a certain percentage of the fair market value that is determined by local assessors to be the total taxable value of land and additions on the property. | Land | Improvement |
|---|---|---|---|---|
| 2025 | -- | $32,490 | $6,200 | $26,290 |
| 2024 | -- | $32,490 | $6,200 | $26,290 |
| 2023 | $901 | $22,410 | $6,130 | $16,280 |
| 2022 | $906 | $22,410 | $6,130 | $16,280 |
| 2021 | $907 | $22,410 | $6,130 | $16,280 |
| 2020 | $822 | $18,970 | $5,320 | $13,650 |
| 2019 | $811 | $17,920 | $5,320 | $12,600 |
| 2018 | $769 | $17,920 | $5,320 | $12,600 |
| 2017 | $594 | $11,770 | $3,610 | $8,160 |
| 2016 | $599 | $13,620 | $3,610 | $10,010 |
| 2015 | $522 | $11,770 | $3,610 | $8,160 |
| 2014 | $584 | $12,530 | $3,850 | $8,680 |
| 2013 | $291 | $12,530 | $3,850 | $8,680 |
Source: Public Records
Map
Nearby Homes
- 124 E Wayne St
- 710 N Freedom Ave
- 511 W Ely St
- 329 1/2 W Main St
- 163 W Market St
- 345 W Market St
- 132 S Haines Ave
- 000 Meadowbrook Ave
- 0 Meadowbrook Ave
- 11344 Walnut Ave NE
- 361 E Main St
- 432 Johnson Ave
- 652 N Webb Ave
- 427 S Union Ave
- 0 Homestead Ave NE
- 356 E Broadway St
- 142 S Seneca Ave
- 000 Klinger Ave
- 14723 Bolton St NE
- 11310 Webb Ave NE