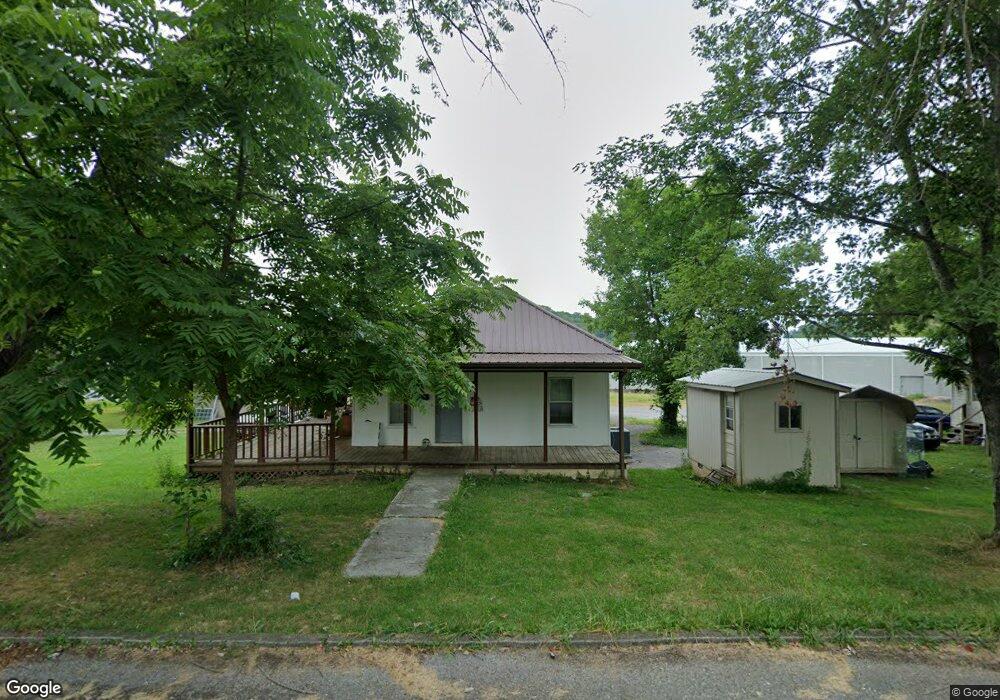
215 W 1st Ave Oneida, TN 37841
Estimated Value: $93,626 - $153,000
--
Bed
1
Bath
800
Sq Ft
$154/Sq Ft
Est. Value
About This Home
This home is located at 215 W 1st Ave, Oneida, TN 37841 and is currently estimated at $123,157, approximately $153 per square foot. 215 W 1st Ave is a home located in Scott County with nearby schools including Oneida Elementary School, Oneida Middle School, and Oneida High School.
Ownership History
Date
Name
Owned For
Owner Type
Purchase Details
Closed on
Jan 23, 2017
Sold by
Reynolds J C
Bought by
Ray Bill
Current Estimated Value
Purchase Details
Closed on
Feb 17, 1970
Bought by
Reynolds Reynolds J and Reynolds Velma J
Create a Home Valuation Report for This Property
The Home Valuation Report is an in-depth analysis detailing your home's value as well as a comparison with similar homes in the area
Home Values in the Area
Average Home Value in this Area
Purchase History
| Date | Buyer | Sale Price | Title Company |
|---|---|---|---|
| Ray Bill | $55,000 | -- | |
| Reynolds Reynolds J | -- | -- |
Source: Public Records
Tax History Compared to Growth
Tax History
| Year | Tax Paid | Tax Assessment Tax Assessment Total Assessment is a certain percentage of the fair market value that is determined by local assessors to be the total taxable value of land and additions on the property. | Land | Improvement |
|---|---|---|---|---|
| 2024 | $645 | $20,650 | $1,250 | $19,400 |
| 2023 | $663 | $20,650 | $1,250 | $19,400 |
| 2022 | $372 | $8,350 | $1,250 | $7,100 |
| 2021 | $317 | $8,350 | $1,250 | $7,100 |
| 2020 | $246 | $8,350 | $1,250 | $7,100 |
| 2019 | $333 | $8,350 | $1,250 | $7,100 |
| 2018 | $333 | $8,350 | $1,250 | $7,100 |
| 2017 | $382 | $9,575 | $1,250 | $8,325 |
| 2016 | $373 | $9,575 | $1,250 | $8,325 |
| 2015 | $361 | $9,575 | $1,250 | $8,325 |
| 2014 | $361 | $9,575 | $1,250 | $8,325 |
Source: Public Records
Map
Nearby Homes
- 18741 Alberta St
- 138 Lloyd St
- 724 W 3rd Ave
- 500 Stanley St
- 200 Burnett Ln
- 342 Vine Ave
- 0 Buffalo Rd Unit 1310923
- 0 Buffalo Rd Unit 23634322
- 0 Buffalo Rd Unit 11503602
- 942 W 3rd Ave
- 191 Ashley Ln
- 120 Wright St
- 610 Paint Rock Rd
- 420 Southern Ln
- 121 Sexton Ln
- 276 Parkview Dr
- 19421 Alberta St
- 167 Holly Hill Dr
- 0 Alberta St
- 0 Eli Ln