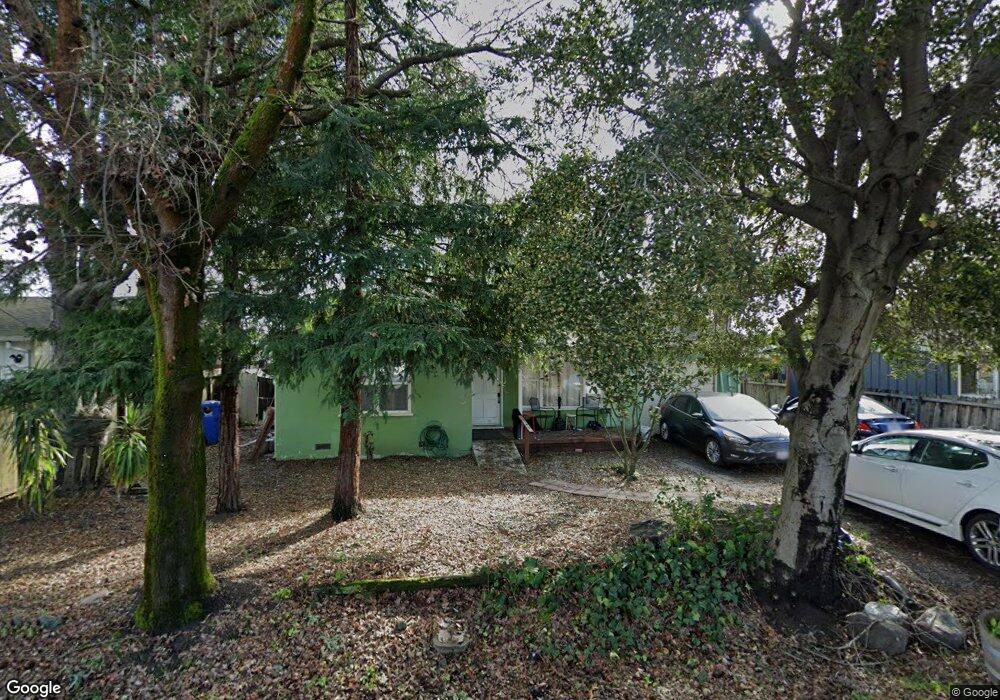
2150 Gardner Ave Santa Rosa, CA 95407
Wright Area Action Group NeighborhoodEstimated Value: $495,000 - $554,280
2
Beds
1
Bath
915
Sq Ft
$571/Sq Ft
Est. Value
About This Home
This home is located at 2150 Gardner Ave, Santa Rosa, CA 95407 and is currently estimated at $522,570, approximately $571 per square foot. 2150 Gardner Ave is a home located in Sonoma County with nearby schools including Robert L. Stevens Elementary, Elsie Allen High School, and St. Michael's Orthodox School.
Ownership History
Date
Name
Owned For
Owner Type
Purchase Details
Closed on
Oct 29, 2025
Sold by
Antone Tanya
Bought by
Want Aaron
Current Estimated Value
Purchase Details
Closed on
May 31, 2002
Sold by
Moya Oscar Ramiro
Bought by
Vigil Moya Lenora
Home Financials for this Owner
Home Financials are based on the most recent Mortgage that was taken out on this home.
Original Mortgage
$115,000
Interest Rate
6.83%
Purchase Details
Closed on
May 30, 2002
Sold by
Powell Paul F and The Powell Family Trust
Bought by
Vigilmoya Lenora and Antone Tanya
Home Financials for this Owner
Home Financials are based on the most recent Mortgage that was taken out on this home.
Original Mortgage
$115,000
Interest Rate
6.83%
Purchase Details
Closed on
Jul 15, 1998
Sold by
Powell George M and Powell Elizabeth N
Bought by
Powell George M and Powell Elizabeth N
Create a Home Valuation Report for This Property
The Home Valuation Report is an in-depth analysis detailing your home's value as well as a comparison with similar homes in the area
Home Values in the Area
Average Home Value in this Area
Purchase History
| Date | Buyer | Sale Price | Title Company |
|---|---|---|---|
| Want Aaron | $120,000 | None Listed On Document | |
| Vigil Moya Lenora | -- | New Century Title Co | |
| Vigilmoya Lenora | $239,500 | New Century Title Co | |
| Powell George M | -- | -- |
Source: Public Records
Mortgage History
| Date | Status | Borrower | Loan Amount |
|---|---|---|---|
| Previous Owner | Vigilmoya Lenora | $115,000 | |
| Closed | Vigilmoya Lenora | $124,250 |
Source: Public Records
Tax History Compared to Growth
Tax History
| Year | Tax Paid | Tax Assessment Tax Assessment Total Assessment is a certain percentage of the fair market value that is determined by local assessors to be the total taxable value of land and additions on the property. | Land | Improvement |
|---|---|---|---|---|
| 2025 | $3,957 | $353,358 | $206,818 | $146,540 |
| 2024 | $3,957 | $346,430 | $202,763 | $143,667 |
| 2023 | $3,957 | $339,638 | $198,788 | $140,850 |
| 2022 | $3,732 | $332,980 | $194,891 | $138,089 |
| 2021 | $3,664 | $326,452 | $191,070 | $135,382 |
| 2020 | $3,649 | $323,105 | $189,111 | $133,994 |
| 2019 | $3,615 | $316,770 | $185,403 | $131,367 |
| 2018 | $3,586 | $310,560 | $181,768 | $128,792 |
| 2017 | $3,512 | $304,471 | $178,204 | $126,267 |
| 2016 | $3,476 | $298,502 | $174,710 | $123,792 |
| 2015 | $3,365 | $294,019 | $172,086 | $121,933 |
| 2014 | $2,452 | $219,000 | $128,000 | $91,000 |
Source: Public Records
Map
Nearby Homes
- 2002 Marble St
- 534 E Jasmine Cir
- 1521 Hughes Ave
- 628 Wisteria Ln
- 2542 Buss Dr
- 2488 Giffen Ave
- 576 E Jasmine Cir
- 1953 Alamo Ln
- 751 W Jasmine Cir Unit 3
- 1461 Trombetta St
- 59 Roundelay Ln
- 666 Brittain Ln
- 62 Romani Ct
- 70 Romani Ct
- Plan 1 at Brittain Oaks
- Plan 4 at Brittain Oaks
- Plan 2 at Brittain Oaks
- Plan 3 at Brittain Oaks
- 94 Leisure Park Cir
- 1538 Surrey Dr
- 2158 Gardner Ave
- 2144 Gardner Ave
- 2166 Gardner Ave
- 2149 Mesa Way
- 1283 Stony Point Rd
- 2148 Mesa Way
- 1203 Stony Point Rd
- 1052 Kenmore Ln
- 2200 Gardner Ave
- 2141 Mesa Way
- 2206 Gardner Ave
- 1277 Stony Point Rd
- 2140 Mesa Way
- 1046 Kenmore Ln
- 1157 Stony Point Rd
- 2133 Mesa Way
- 2132 Mesa Way
- 1038 Kenmore Ln
- 2212 Gardner Ave
- 1149 Stony Point Rd