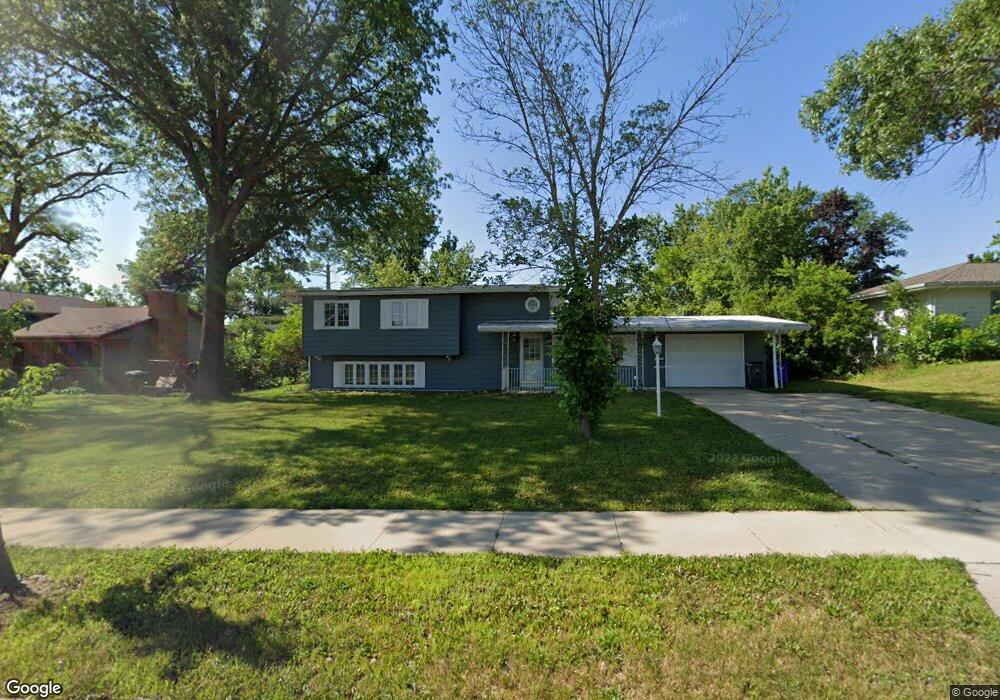
2151 42nd St NE Cedar Rapids, IA 52402
Estimated Value: $192,000 - $227,939
4
Beds
2
Baths
1,720
Sq Ft
$122/Sq Ft
Est. Value
About This Home
This home is located at 2151 42nd St NE, Cedar Rapids, IA 52402 and is currently estimated at $208,985, approximately $121 per square foot. 2151 42nd St NE is a home located in Linn County with nearby schools including Pierce Elementary School, Franklin Middle School, and John F. Kennedy High School.
Ownership History
Date
Name
Owned For
Owner Type
Purchase Details
Closed on
Dec 4, 2015
Sold by
Foster Ebony S Jones and Jones Foster Ebony S
Bought by
Dunham Andrew M and Dunham Cynthia L
Current Estimated Value
Purchase Details
Closed on
Jun 21, 2014
Sold by
Foster Robert L and Jones Foster Ebony S
Bought by
Foster Robert L and Jones Foster Ebony S
Create a Home Valuation Report for This Property
The Home Valuation Report is an in-depth analysis detailing your home's value as well as a comparison with similar homes in the area
Home Values in the Area
Average Home Value in this Area
Purchase History
| Date | Buyer | Sale Price | Title Company |
|---|---|---|---|
| Dunham Andrew M | $79,000 | None Available | |
| Foster Robert L | -- | None Available |
Source: Public Records
Tax History Compared to Growth
Tax History
| Year | Tax Paid | Tax Assessment Tax Assessment Total Assessment is a certain percentage of the fair market value that is determined by local assessors to be the total taxable value of land and additions on the property. | Land | Improvement |
|---|---|---|---|---|
| 2025 | $3,266 | $201,900 | $35,100 | $166,800 |
| 2024 | $3,490 | $184,500 | $31,200 | $153,300 |
| 2023 | $3,490 | $184,500 | $31,200 | $153,300 |
| 2022 | $3,332 | $165,500 | $31,200 | $134,300 |
| 2021 | $3,424 | $160,800 | $29,300 | $131,500 |
| 2020 | $3,424 | $155,200 | $27,300 | $127,900 |
| 2019 | $3,204 | $148,600 | $27,300 | $121,300 |
| 2018 | $3,114 | $148,600 | $27,300 | $121,300 |
| 2017 | $2,544 | $116,800 | $27,300 | $89,500 |
| 2016 | $2,737 | $132,100 | $27,300 | $104,800 |
| 2015 | $2,552 | $130,270 | $27,310 | $102,960 |
| 2014 | $2,516 | $130,270 | $27,310 | $102,960 |
| 2013 | $2,456 | $130,270 | $27,310 | $102,960 |
Source: Public Records
Map
Nearby Homes
- 2106 42nd St NE
- 2044 Evergreen St NE
- 3858 Northwood Dr NE
- 4216 Marilyn Dr NE
- 2400 Brookland Dr NE
- 2041 Birchwood Dr NE
- 2520 Falbrook Dr NE
- 4609 White Pine Dr NE
- 2611 Brookland Dr NE
- 1638 47th St NE
- 1006 Messina Dr NE
- 1138 Messina Dr NE
- 2445 Glass Rd NE
- 4460 Westchester Dr NE Unit C
- 4309 Benton St NE
- 1611 Hollywood Blvd NE
- 3604 Heatheridge Dr NE
- 1721 34th St NE
- 4545 Westchester Dr NE Unit D
- 4645 Westchester Dr NE Unit A
- 2157 42nd St NE
- 2141 42nd St NE
- 2152 Evergreen St NE
- 2158 Evergreen St NE
- 2144 Evergreen St NE
- 2163 42nd St NE
- 2129 42nd St NE
- 2164 Evergreen St NE
- 2136 Evergreen St NE
- 2152 42nd St NE
- 2207 42nd St NE
- 2144 42nd St NE
- 2158 42nd St NE
- 2206 Evergreen St NE
- 2128 Evergreen St NE
- 2164 42nd St NE
- 2121 42nd St NE
- 2130 42nd St NE
- 2215 42nd St NE
- 2145 Evergreen St NE