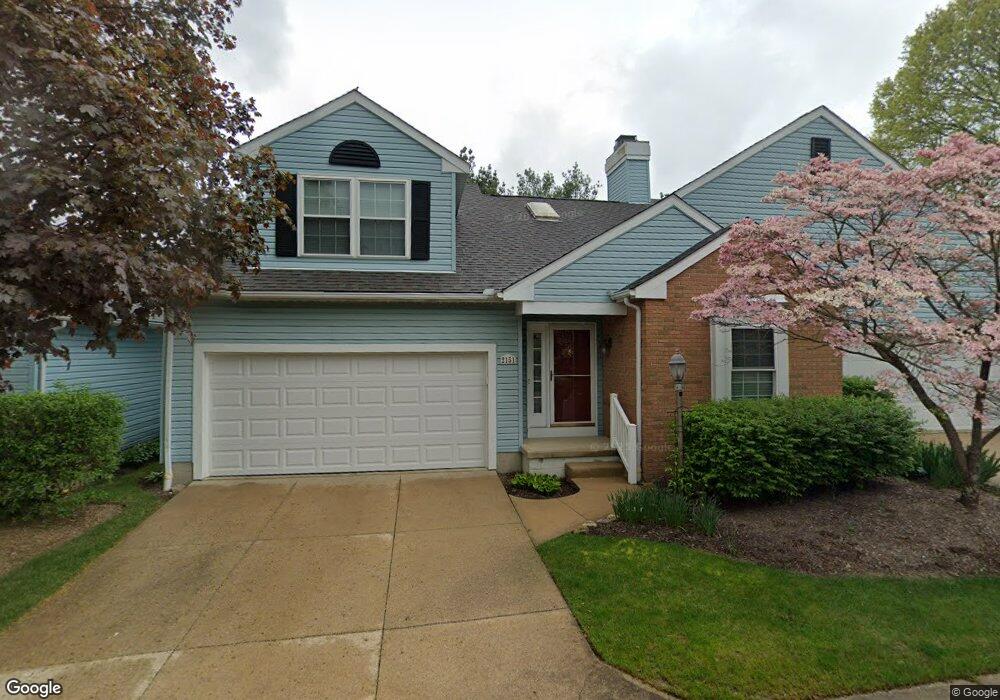
2151 Abbey Rd Akron, OH 44312
Ellet NeighborhoodEstimated Value: $215,000 - $248,116
3
Beds
3
Baths
1,716
Sq Ft
$134/Sq Ft
Est. Value
About This Home
This home is located at 2151 Abbey Rd, Akron, OH 44312 and is currently estimated at $229,529, approximately $133 per square foot. 2151 Abbey Rd is a home located in Summit County with nearby schools including Ellet High School, Summit Academy Akron Elementary School, and Akron Preparatory school.
Ownership History
Date
Name
Owned For
Owner Type
Purchase Details
Closed on
Mar 12, 2024
Sold by
Huth Diane M
Bought by
Whitehair Jack L and Whitehair Martha J
Current Estimated Value
Purchase Details
Closed on
May 6, 2009
Sold by
Palmer Erin and Mcgaffick Nikole
Bought by
Huth Diane
Purchase Details
Closed on
Feb 6, 2009
Sold by
Huth Diane M
Bought by
Mcgaffick Nikole and Palmer Erin
Purchase Details
Closed on
May 30, 2001
Sold by
Jean Baker Doris
Bought by
Baker Doris Jean
Purchase Details
Closed on
Jul 13, 1994
Sold by
Quality Scrub West Inc
Bought by
Denham William W and Denham Lois M
Home Financials for this Owner
Home Financials are based on the most recent Mortgage that was taken out on this home.
Original Mortgage
$80,000
Interest Rate
5.75%
Mortgage Type
New Conventional
Create a Home Valuation Report for This Property
The Home Valuation Report is an in-depth analysis detailing your home's value as well as a comparison with similar homes in the area
Home Values in the Area
Average Home Value in this Area
Purchase History
| Date | Buyer | Sale Price | Title Company |
|---|---|---|---|
| Whitehair Jack L | $207,500 | None Listed On Document | |
| Huth Diane | -- | None Available | |
| Mcgaffick Nikole | -- | None Available | |
| Baker Doris Jean | -- | -- | |
| Denham William W | $132,900 | -- |
Source: Public Records
Mortgage History
| Date | Status | Borrower | Loan Amount |
|---|---|---|---|
| Previous Owner | Denham William W | $80,000 |
Source: Public Records
Tax History Compared to Growth
Tax History
| Year | Tax Paid | Tax Assessment Tax Assessment Total Assessment is a certain percentage of the fair market value that is determined by local assessors to be the total taxable value of land and additions on the property. | Land | Improvement |
|---|---|---|---|---|
| 2025 | $3,374 | $74,260 | $8,715 | $65,545 |
| 2024 | $3,374 | $74,260 | $8,715 | $65,545 |
| 2023 | $3,374 | $74,260 | $8,715 | $65,545 |
| 2022 | $3,113 | $55,916 | $6,552 | $49,364 |
| 2021 | $3,117 | $55,916 | $6,552 | $49,364 |
| 2020 | $3,068 | $55,910 | $6,550 | $49,360 |
| 2019 | $3,081 | $51,750 | $7,240 | $44,510 |
| 2018 | $3,646 | $51,750 | $7,240 | $44,510 |
| 2017 | $3,259 | $51,750 | $7,240 | $44,510 |
| 2016 | $3,262 | $45,440 | $7,240 | $38,200 |
| 2015 | $3,259 | $45,440 | $7,240 | $38,200 |
| 2014 | $3,277 | $45,440 | $7,240 | $38,200 |
| 2013 | $3,495 | $50,900 | $7,240 | $43,660 |
Source: Public Records
Map
Nearby Homes
- 2155 Abbey Rd
- 640 Plainfield Rd
- 2465 Ogden Ave
- 2127 Quayle Dr
- 586 Ingalls Rd
- 2146 Daniels Ave
- 2239 Springfield Center Rd
- 452 Herbert Rd
- 805 Utica Ave
- 880 Utica Ave
- 2670 Albrecht Ave
- 480 Wirth Ave
- 490 Stevenson Ave
- 2331 E Market St Unit 608A
- 2331 E Market St Unit 204A
- 2331 E Market St Unit 215D
- 2331 E Market St Unit 206A
- 218 Canton Rd
- 198 Hilbish Ave
- 2305 E Waterloo Rd
- 2151 Abbey Rd Unit 37
- 2147 Abbey Rd
- 2152 Abbey Rd
- 2146 Abbey Rd
- 2142 Abbey Rd Unit 41
- 610 Plainfield Rd
- 527 Shannon Ct Unit 1
- 2172 Abbey Rd
- 2172 Abbey Rd Unit 34
- 521 Shannon Ct Unit 2
- 2242 Abbey Rd Unit 12
- 2176 Abbey Rd
- 607 Caine Rd
- 517 Shannon Ct Unit 3
- 517 Shannon Ct
- 2238 Abbey Rd Unit 13
- 2238 Abbey Rd
- 522 Shannon Ct Unit 4
- 514 Shannon Ct Unit 5
- 616 Plainfield Rd