Estimated Value: $163,000 - $244,000
2
Beds
2
Baths
876
Sq Ft
$231/Sq Ft
Est. Value
About This Home
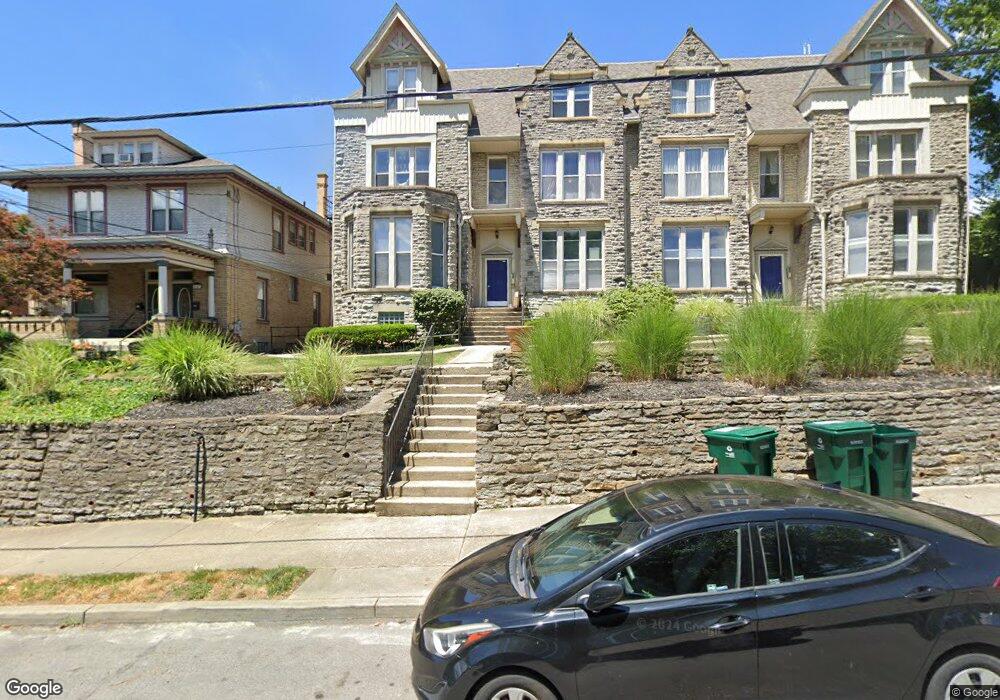
This home is located at 2151 Fulton Ave Unit C, Cincinnati, OH 45206 and is currently estimated at $202,177, approximately $230 per square foot. 2151 Fulton Ave Unit C is a home located in Hamilton County with nearby schools including Frederick Douglass Elementary School, Robert A. Taft Information Technology High School, and Clark Montessori High School.
Ownership History
Date
Name
Owned For
Owner Type
Purchase Details
Closed on
Jul 15, 2022
Sold by
Bala Sharma Madhu and Bala Kuldip
Bought by
Brockman Amanda Jean
Current Estimated Value
Home Financials for this Owner
Home Financials are based on the most recent Mortgage that was taken out on this home.
Original Mortgage
$143,900
Outstanding Balance
$137,069
Interest Rate
5.23%
Mortgage Type
New Conventional
Estimated Equity
$65,108
Purchase Details
Closed on
Jun 12, 2019
Sold by
Stinehelfer Susan E
Bought by
Sharma Madhu Bala and Sharma Kuldip
Home Financials for this Owner
Home Financials are based on the most recent Mortgage that was taken out on this home.
Original Mortgage
$115,409
Interest Rate
4%
Mortgage Type
New Conventional
Purchase Details
Closed on
Jun 24, 2005
Sold by
Lm Real Estate Investments Llc
Bought by
Stinehelfer Susan E
Home Financials for this Owner
Home Financials are based on the most recent Mortgage that was taken out on this home.
Original Mortgage
$162,500
Interest Rate
5.87%
Mortgage Type
Fannie Mae Freddie Mac
Create a Home Valuation Report for This Property
The Home Valuation Report is an in-depth analysis detailing your home's value as well as a comparison with similar homes in the area
Home Values in the Area
Average Home Value in this Area
Purchase History
| Date | Buyer | Sale Price | Title Company |
|---|---|---|---|
| Brockman Amanda Jean | $159,900 | 360 American Title | |
| Sharma Madhu Bala | $135,775 | None Available | |
| Stinehelfer Susan E | $162,500 | None Available |
Source: Public Records
Mortgage History
| Date | Status | Borrower | Loan Amount |
|---|---|---|---|
| Open | Brockman Amanda Jean | $143,900 | |
| Previous Owner | Sharma Madhu Bala | $115,409 | |
| Previous Owner | Stinehelfer Susan E | $162,500 |
Source: Public Records
Tax History Compared to Growth
Tax History
| Year | Tax Paid | Tax Assessment Tax Assessment Total Assessment is a certain percentage of the fair market value that is determined by local assessors to be the total taxable value of land and additions on the property. | Land | Improvement |
|---|---|---|---|---|
| 2024 | $3,337 | $55,965 | $7,560 | $48,405 |
| 2023 | $3,412 | $55,965 | $7,560 | $48,405 |
| 2022 | $3,230 | $47,523 | $7,560 | $39,963 |
| 2021 | $3,110 | $47,523 | $7,560 | $39,963 |
| 2020 | $3,201 | $47,523 | $7,560 | $39,963 |
| 2019 | $2,957 | $40,152 | $7,000 | $33,152 |
| 2018 | $2,961 | $40,152 | $7,000 | $33,152 |
| 2017 | $2,813 | $40,152 | $7,000 | $33,152 |
| 2016 | $2,971 | $41,812 | $7,613 | $34,199 |
| 2015 | $1,409 | $41,812 | $7,613 | $34,199 |
| 2014 | $1,419 | $41,812 | $7,613 | $34,199 |
| 2013 | $1,659 | $48,059 | $8,750 | $39,309 |
Source: Public Records
About This Building
Map
Nearby Homes
- 2110 Fulton Ave
- 2114 Fulton Ave
- 2100 Fulton Ave
- 2100 Sinton Ave
- 964 Auburnview Dr
- 964 Auburnview Dr Unit 3E
- 2232 Fulton Ave
- 967 Windsor St
- 965 Windsor St
- 2106 Kemper Ln
- 2226 Kenton St
- 2019 Calvin Cliff St Unit 10
- 2191 Victory Pkwy
- 2195 Victory Pkwy
- 2199 Victory Pkwy
- 2356 Concord St
- 2358 Concord St
- 2210 Victory Pkwy
- 2362 Concord St
- 2361 Concord St
- 2151 Fulton Ave Unit B
- 2151 Fulton Ave Unit E5
- 2151 Fulton Ave Unit 5E
- 2151 Fulton Ave Unit 2151B
- 2151 Fulton Ave Unit 2151F
- 2151 Fulton Ave Unit 2151C
- 2151 Fulton Ave Unit 2151D
- 2151 Fulton Ave Unit 2151E
- 2151 Fulton Ave Unit F
- 2151 Fulton Ave Unit A
- 2151 Fulton Ave Unit 5
- 2151 Fulton Ave Unit 2
- 2151 Fulton Ave Unit E
- 2151 Fulton Ave Unit 3
- 2124 Fulton Ave Unit 7
- 2124 Fulton Ave Unit 8
- 2124 Fulton Ave Unit 9
- 2124 Fulton Ave
- 2119 Fulton Ave Unit E
- 2119 Fulton Ave Unit G