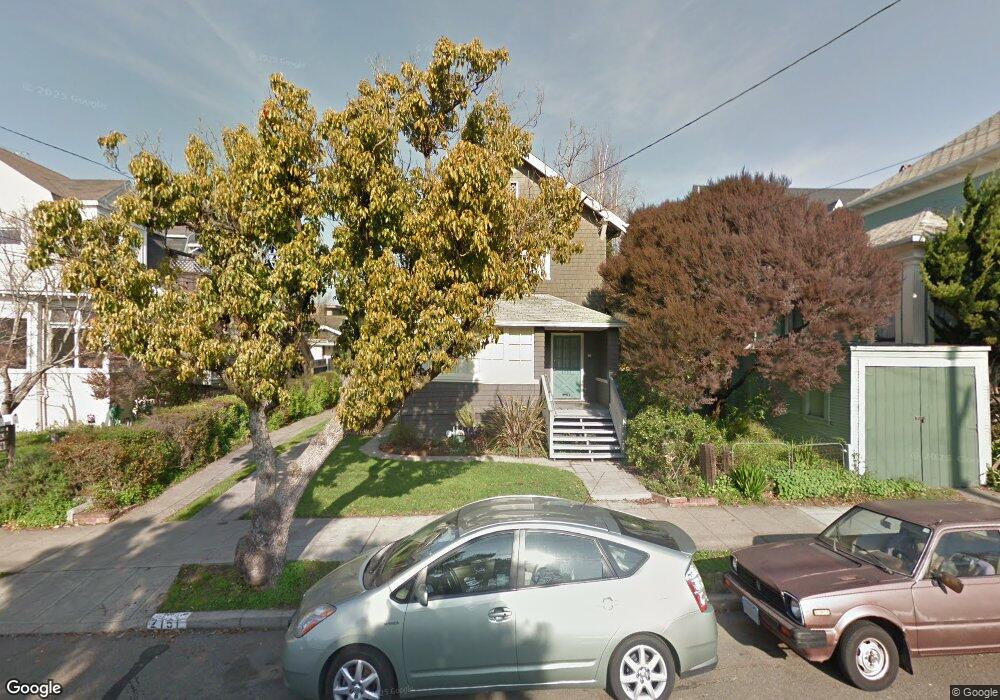
2151 Stuart St Berkeley, CA 94705
South Berkeley NeighborhoodEstimated Value: $529,000 - $847,000
2
Beds
1
Bath
741
Sq Ft
$891/Sq Ft
Est. Value
About This Home
This home is located at 2151 Stuart St, Berkeley, CA 94705 and is currently estimated at $659,946, approximately $890 per square foot. 2151 Stuart St is a home located in Alameda County with nearby schools including Malcolm X Elementary School, Emerson Elementary School, and John Muir Elementary School.
Ownership History
Date
Name
Owned For
Owner Type
Purchase Details
Closed on
Nov 6, 2008
Sold by
Malcolm Reed A
Bought by
Malcolm Reed A and Muprhy Johanna M
Current Estimated Value
Home Financials for this Owner
Home Financials are based on the most recent Mortgage that was taken out on this home.
Original Mortgage
$280,000
Outstanding Balance
$183,708
Interest Rate
6.07%
Mortgage Type
Purchase Money Mortgage
Estimated Equity
$476,238
Purchase Details
Closed on
Nov 5, 2008
Sold by
Baar Kenneth K
Bought by
Malcolm Reed A
Home Financials for this Owner
Home Financials are based on the most recent Mortgage that was taken out on this home.
Original Mortgage
$280,000
Outstanding Balance
$183,708
Interest Rate
6.07%
Mortgage Type
Purchase Money Mortgage
Estimated Equity
$476,238
Purchase Details
Closed on
Nov 4, 2008
Sold by
Murphy Johanna
Bought by
Malcolm Reed A
Home Financials for this Owner
Home Financials are based on the most recent Mortgage that was taken out on this home.
Original Mortgage
$280,000
Outstanding Balance
$183,708
Interest Rate
6.07%
Mortgage Type
Purchase Money Mortgage
Estimated Equity
$476,238
Create a Home Valuation Report for This Property
The Home Valuation Report is an in-depth analysis detailing your home's value as well as a comparison with similar homes in the area
Home Values in the Area
Average Home Value in this Area
Purchase History
| Date | Buyer | Sale Price | Title Company |
|---|---|---|---|
| Malcolm Reed A | -- | Old Republic Title Company | |
| Malcolm Reed A | $350,000 | Old Republic Title Company | |
| Malcolm Reed A | -- | Old Republic Title Company |
Source: Public Records
Mortgage History
| Date | Status | Borrower | Loan Amount |
|---|---|---|---|
| Open | Malcolm Reed A | $280,000 |
Source: Public Records
Tax History
| Year | Tax Paid | Tax Assessment Tax Assessment Total Assessment is a certain percentage of the fair market value that is determined by local assessors to be the total taxable value of land and additions on the property. | Land | Improvement |
|---|---|---|---|---|
| 2025 | $6,884 | $450,684 | $135,205 | $315,479 |
| 2024 | $6,884 | $441,850 | $132,555 | $309,295 |
| 2023 | $6,741 | $433,187 | $129,956 | $303,231 |
| 2022 | $6,623 | $424,696 | $127,409 | $297,287 |
| 2021 | $6,638 | $416,370 | $124,911 | $291,459 |
| 2020 | $6,306 | $412,103 | $123,631 | $288,472 |
| 2019 | $6,080 | $404,025 | $121,207 | $282,818 |
| 2018 | $5,981 | $396,104 | $118,831 | $277,273 |
| 2017 | $5,759 | $388,338 | $116,501 | $271,837 |
| 2016 | $5,584 | $380,725 | $114,217 | $266,508 |
| 2015 | $5,512 | $375,010 | $112,503 | $262,507 |
| 2014 | $5,479 | $367,667 | $110,300 | $257,367 |
Source: Public Records
Map
Nearby Homes
- 2923 Wheeler St
- 2319 Ward St
- 2243 Ashby Ave
- 2110 Ashby Ave
- 2702 Dana St
- 2057 Emerson St
- 2917 Telegraph Ave
- 3046 Deakin St
- 2018 Blake St
- 2124 Prince St
- 2935 Florence St
- 2550 Dana St Unit 2F
- 1901 Parker St Unit 3
- 2535 Chilton Way
- 2701 Grant St
- 629 66th St
- 6555 Shattuck Ave
- 2926 Ellis St
- 6445 Irwin Ct
- 2477 Prince St
- 2151 Stuart St Unit Back
- 2151 Stuart St Unit 2153
- 2151 Stuart St
- 2149 Stuart St Unit 3
- 2149 Stuart St Unit 1
- 2744 Fulton St
- 2746 Fulton St
- 2740 Fulton St
- 2147 Stuart St Unit 4
- 2147 Stuart St Unit 3
- 2147 Stuart St Unit 2
- 2147 Stuart St Unit 1
- 2738 Fulton St
- 2152 Ward St
- 2148 Ward St
- 2142 Ward St
- 2154 Ward St
- 2158 Stuart St
- 2800 Fulton St
- 2156 Ward St
Your Personal Tour Guide
Ask me questions while you tour the home.