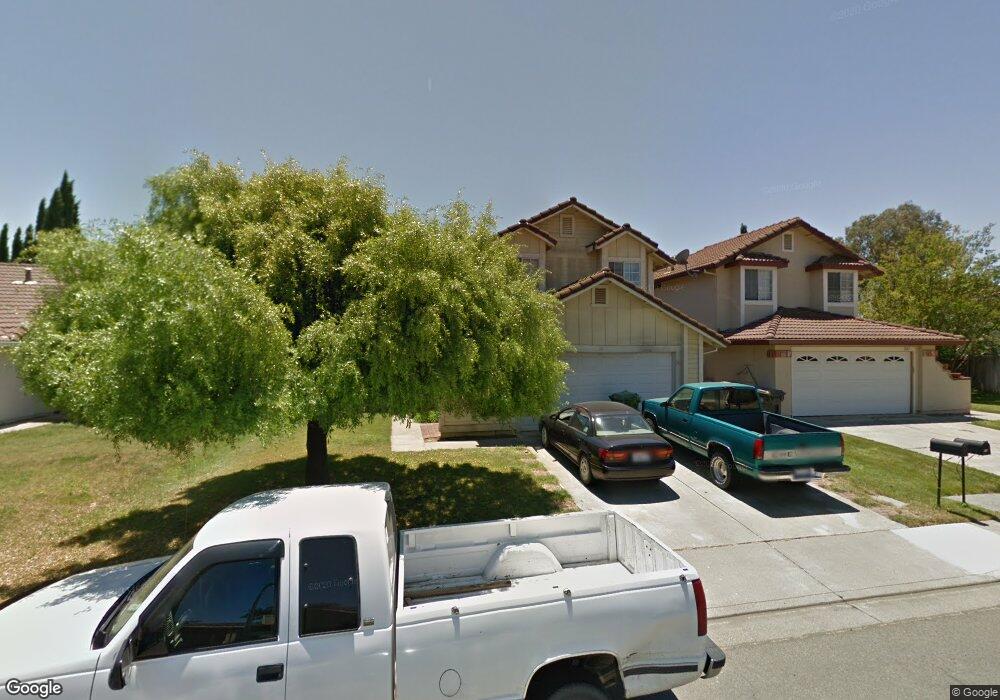
2151 Sunhaven Cir Fairfield, CA 94533
Estimated Value: $498,000 - $526,000
3
Beds
3
Baths
1,403
Sq Ft
$362/Sq Ft
Est. Value
About This Home
This home is located at 2151 Sunhaven Cir, Fairfield, CA 94533 and is currently estimated at $508,214, approximately $362 per square foot. 2151 Sunhaven Cir is a home located in Solano County with nearby schools including Crystal Middle School, Armijo High School, and We R Family Christian School.
Ownership History
Date
Name
Owned For
Owner Type
Purchase Details
Closed on
Sep 5, 2023
Sold by
Lancaster Robert L and Lancaster Margaret L
Bought by
Robert And Margaret Lancaster Living Trust and Lancaster
Current Estimated Value
Purchase Details
Closed on
Mar 11, 1999
Sold by
Yu Chung Ing Jao
Bought by
Lancaster Robert L and Lancaster Margaret L
Home Financials for this Owner
Home Financials are based on the most recent Mortgage that was taken out on this home.
Original Mortgage
$146,880
Interest Rate
6.73%
Mortgage Type
VA
Purchase Details
Closed on
Feb 17, 1996
Sold by
Jao Nancy
Bought by
Yu Chung Ing Jao
Purchase Details
Closed on
Feb 19, 1994
Sold by
Yu Sen Chang and Yu Chung Ing Jao
Bought by
Jao Yun C and Jao Nancy
Home Financials for this Owner
Home Financials are based on the most recent Mortgage that was taken out on this home.
Original Mortgage
$100,000
Interest Rate
7%
Mortgage Type
Seller Take Back
Create a Home Valuation Report for This Property
The Home Valuation Report is an in-depth analysis detailing your home's value as well as a comparison with similar homes in the area
Home Values in the Area
Average Home Value in this Area
Purchase History
| Date | Buyer | Sale Price | Title Company |
|---|---|---|---|
| Robert And Margaret Lancaster Living Trust | -- | None Listed On Document | |
| Lancaster Robert L | $144,000 | Frontier Title Company | |
| Yu Chung Ing Jao | -- | Frontier Title Company | |
| Yu Chung Ing Jao | -- | -- | |
| Jao Yun C | $145,000 | -- |
Source: Public Records
Mortgage History
| Date | Status | Borrower | Loan Amount |
|---|---|---|---|
| Previous Owner | Lancaster Robert L | $146,880 | |
| Previous Owner | Jao Yun C | $100,000 |
Source: Public Records
Tax History Compared to Growth
Tax History
| Year | Tax Paid | Tax Assessment Tax Assessment Total Assessment is a certain percentage of the fair market value that is determined by local assessors to be the total taxable value of land and additions on the property. | Land | Improvement |
|---|---|---|---|---|
| 2025 | $2,459 | $225,740 | $65,839 | $159,901 |
| 2024 | $2,459 | $221,315 | $64,549 | $156,766 |
| 2023 | $2,383 | $216,977 | $63,284 | $153,693 |
| 2022 | $2,352 | $212,724 | $62,044 | $150,680 |
| 2021 | $2,328 | $208,554 | $60,828 | $147,726 |
| 2020 | $2,273 | $206,417 | $60,205 | $146,212 |
| 2019 | $2,216 | $202,371 | $59,025 | $143,346 |
| 2018 | $2,285 | $198,404 | $57,868 | $140,536 |
| 2017 | $2,179 | $194,515 | $56,734 | $137,781 |
| 2016 | $2,156 | $190,702 | $55,622 | $135,080 |
| 2015 | $2,012 | $187,838 | $54,787 | $133,051 |
| 2014 | $1,992 | $184,159 | $53,714 | $130,445 |
Source: Public Records
Map
Nearby Homes
- 109 Creek View Cir
- 113 Creek View Cir
- 435 Hamilton Dr
- 266 De Soto Dr
- 2537 Woolner Ave
- 1625 Park Ln Unit 11
- 1842 Minnesota St
- 1007 4th St
- 1661 Minnesota St
- 1731 Michigan St
- 225 Pennsylvania Ave Unit B5
- 1200 Truman St
- 1042 Hayes St
- 3451 Astoria Cir
- 1443 Minnesota St
- 527 Great Jones St
- 1201 Missouri St
- 1137 Ohio St
- 3418 Astoria Ct
- 1047 Ohio St
- 2155 Sunhaven Cir
- 2147 Sunhaven Cir
- 2159 Sunhaven Cir
- 2120 Sunhaven Cir
- 2143 Sunhaven Cir
- 2124 Sunhaven Cir
- 2116 Sunhaven Cir
- 2152 Sunhaven Cir
- 2128 Sunhaven Cir
- 2163 Sunhaven Cir
- 2156 Sunhaven Cir
- 2112 Sunhaven Cir
- 2148 Sunhaven Cir
- 2139 Sunhaven Cir
- 2160 Sunhaven Cir
- 2144 Sunhaven Cir
- 2108 Sunhaven Cir
- 2132 Sunhaven Cir
- 2167 Sunhaven Cir
- 2164 Sunhaven Cir