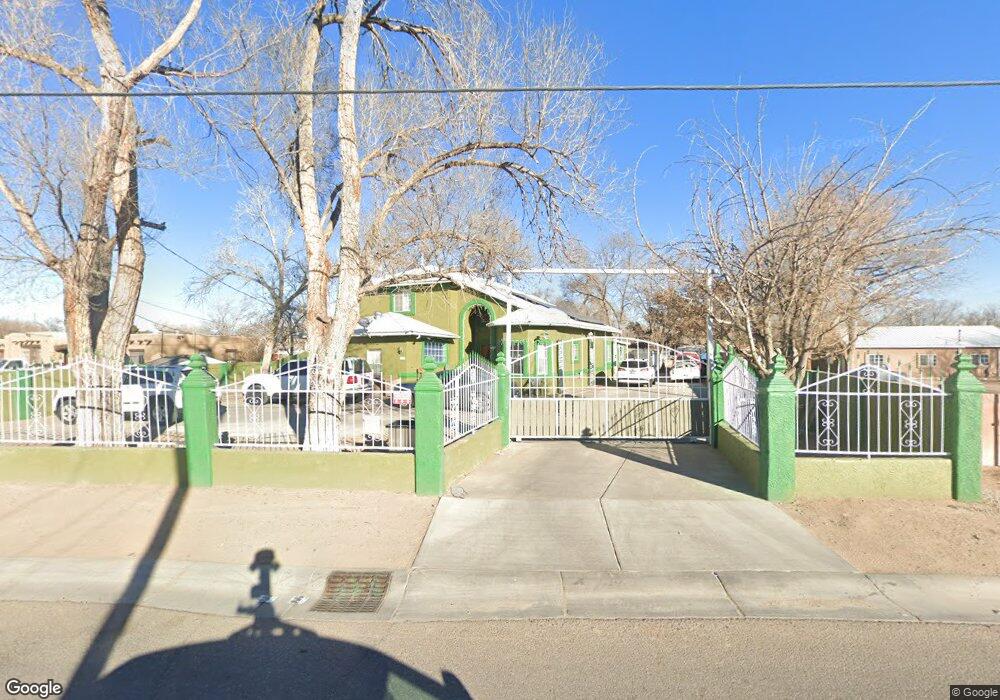
2152 Perry Rd SW Albuquerque, NM 87105
Estimated Value: $280,000 - $377,653
4
Beds
3
Baths
2,217
Sq Ft
$150/Sq Ft
Est. Value
About This Home
This home is located at 2152 Perry Rd SW, Albuquerque, NM 87105 and is currently estimated at $332,413, approximately $149 per square foot. 2152 Perry Rd SW is a home located in Bernalillo County with nearby schools including Kit Carson Elementary School, Ernie Pyle Middle School, and Rio Grande High School.
Ownership History
Date
Name
Owned For
Owner Type
Purchase Details
Closed on
Jan 9, 2020
Sold by
Dorado Maria
Bought by
Dorado Ruben
Current Estimated Value
Purchase Details
Closed on
Mar 16, 2005
Sold by
Dorado Ruben
Bought by
Dorado Ruben and Dorado Maria
Home Financials for this Owner
Home Financials are based on the most recent Mortgage that was taken out on this home.
Original Mortgage
$127,999
Outstanding Balance
$72,335
Interest Rate
7.49%
Mortgage Type
Purchase Money Mortgage
Estimated Equity
$260,078
Purchase Details
Closed on
May 23, 2003
Sold by
Torres Tomas and Torres Estela
Bought by
Ortega Mireya
Home Financials for this Owner
Home Financials are based on the most recent Mortgage that was taken out on this home.
Original Mortgage
$134,800
Interest Rate
5.79%
Mortgage Type
Purchase Money Mortgage
Create a Home Valuation Report for This Property
The Home Valuation Report is an in-depth analysis detailing your home's value as well as a comparison with similar homes in the area
Home Values in the Area
Average Home Value in this Area
Purchase History
| Date | Buyer | Sale Price | Title Company |
|---|---|---|---|
| Dorado Ruben | -- | None Available | |
| Dorado Ruben | -- | First American Title Ins Co | |
| Dorado Ruben | -- | First American Title Ins Co | |
| Ortega Mireya | -- | Albuquerque Title Co |
Source: Public Records
Mortgage History
| Date | Status | Borrower | Loan Amount |
|---|---|---|---|
| Open | Dorado Ruben | $127,999 | |
| Previous Owner | Ortega Mireya | $134,800 | |
| Closed | Dorado Ruben | $31,999 |
Source: Public Records
Tax History Compared to Growth
Tax History
| Year | Tax Paid | Tax Assessment Tax Assessment Total Assessment is a certain percentage of the fair market value that is determined by local assessors to be the total taxable value of land and additions on the property. | Land | Improvement |
|---|---|---|---|---|
| 2025 | $2,562 | $71,094 | $13,291 | $57,803 |
| 2024 | $2,562 | $69,023 | $12,904 | $56,119 |
| 2023 | $2,516 | $67,013 | $12,528 | $54,485 |
| 2022 | $2,368 | $65,061 | $12,163 | $52,898 |
| 2021 | $2,290 | $63,167 | $11,809 | $51,358 |
| 2020 | $2,249 | $61,328 | $11,466 | $49,862 |
| 2019 | $2,262 | $61,694 | $11,466 | $50,228 |
| 2018 | $2,249 | $61,694 | $11,466 | $50,228 |
| 2017 | $2,252 | $61,728 | $11,466 | $50,262 |
| 2016 | $2,234 | $62,361 | $11,466 | $50,895 |
| 2015 | $62,961 | $62,961 | $11,466 | $51,495 |
| 2014 | $2,216 | $63,028 | $11,466 | $51,562 |
| 2013 | -- | $61,508 | $7,176 | $54,332 |
Source: Public Records
Map
Nearby Homes
- 1639 Ferris Ave SW
- 1427 Vito Romero Rd SW
- 1723 Valley Rd SW
- 813 Aritas Rd SW
- 1516 1 2 Gallegos Rd SW
- 2031 Sanford Ave SW
- 2019 Sanford Ave SW
- 1319 La Vega Dr SW
- 2215 Tapia Blvd SW
- 1116 Isleta Blvd SW
- 2119 Besler Ln SW
- 1233 Montrose Place SW
- 835 Armijo Rd SW
- 1816 Wildwood Ln SW
- 1816 San Ygnacio Rd SW
- 1567 Las Glorietas SW
- 2815 Linda Place SW
- 3641 Cameo Dr SE
- 1151 Tapia Blvd SW
- 2617 Verde Rd SW
- 2150 Perry Rd SW
- 2154 Perry Rd SW
- 2140 Perry Rd SW
- 2139 Perry Rd SW
- 1404 Elena Cir SW
- 2141 Perry Rd SW
- 2148 Perry Rd SW
- 1415 Rinconado Ln SW
- 1309 Rinconado Ln SW
- 2121 Perry Rd SW
- 1402 Elena Cir SW
- 1425 Elena Cir SW
- 1417 Elena Cir SW
- 2143 Perry Rd SW
- 1331 Rinconado Ln SW
- 2145 Perry Rd SW
- 1419 Elena Cir SW
- 1328 Elena Cir SW
- 1429 Elena Cir SW
- 2115 Perry Rd SW