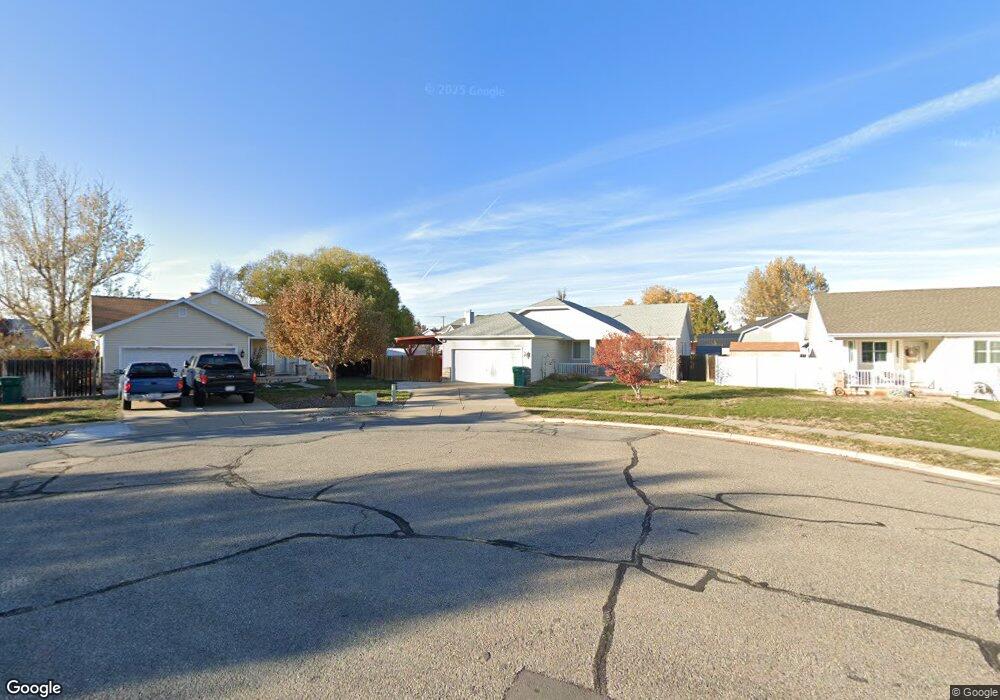
2152 W 1345 N Layton, UT 84041
Estimated Value: $429,000 - $462,000
3
Beds
2
Baths
1,395
Sq Ft
$318/Sq Ft
Est. Value
About This Home
This home is located at 2152 W 1345 N, Layton, UT 84041 and is currently estimated at $444,080, approximately $318 per square foot. 2152 W 1345 N is a home located in Davis County with nearby schools including Ellison Park School, Shoreline Junior High School, and Layton High School.
Ownership History
Date
Name
Owned For
Owner Type
Purchase Details
Closed on
Jan 30, 2012
Sold by
Talamantez Sarah A
Bought by
Talamantez Rick N
Current Estimated Value
Home Financials for this Owner
Home Financials are based on the most recent Mortgage that was taken out on this home.
Original Mortgage
$164,645
Outstanding Balance
$113,629
Interest Rate
4.12%
Mortgage Type
FHA
Estimated Equity
$330,451
Purchase Details
Closed on
Aug 4, 2005
Sold by
Bringhurst Michael T and Bringhurst Brandice P
Bought by
Talamantez Sarah A and Talamantez Rick N
Home Financials for this Owner
Home Financials are based on the most recent Mortgage that was taken out on this home.
Original Mortgage
$27,000
Interest Rate
5.05%
Mortgage Type
Stand Alone Second
Purchase Details
Closed on
Apr 23, 1997
Sold by
Seasons Layton Llc
Bought by
Bringhurst Michael T and Bringhurst Brandice P
Home Financials for this Owner
Home Financials are based on the most recent Mortgage that was taken out on this home.
Original Mortgage
$117,100
Interest Rate
7.86%
Create a Home Valuation Report for This Property
The Home Valuation Report is an in-depth analysis detailing your home's value as well as a comparison with similar homes in the area
Home Values in the Area
Average Home Value in this Area
Purchase History
| Date | Buyer | Sale Price | Title Company |
|---|---|---|---|
| Talamantez Rick N | -- | First American Title | |
| Talamantez Sarah A | -- | Millcreek Land Title Insuran | |
| Bringhurst Michael T | -- | Merrill Title Company |
Source: Public Records
Mortgage History
| Date | Status | Borrower | Loan Amount |
|---|---|---|---|
| Open | Talamantez Rick N | $164,645 | |
| Closed | Talamantez Sarah A | $27,000 | |
| Closed | Talamantez Sarah A | $108,000 | |
| Previous Owner | Bringhurst Michael T | $117,100 |
Source: Public Records
Tax History Compared to Growth
Tax History
| Year | Tax Paid | Tax Assessment Tax Assessment Total Assessment is a certain percentage of the fair market value that is determined by local assessors to be the total taxable value of land and additions on the property. | Land | Improvement |
|---|---|---|---|---|
| 2025 | $2,154 | $226,050 | $125,363 | $100,687 |
| 2024 | $2,086 | $220,550 | $136,770 | $83,780 |
| 2023 | $1,969 | $367,000 | $139,173 | $227,827 |
| 2022 | $2,152 | $217,800 | $84,449 | $133,351 |
| 2021 | $1,915 | $289,000 | $126,682 | $162,318 |
| 2020 | $1,726 | $250,000 | $107,257 | $142,743 |
| 2019 | $1,678 | $238,000 | $108,474 | $129,526 |
| 2018 | $1,510 | $215,000 | $95,314 | $119,686 |
| 2016 | $1,349 | $99,055 | $38,250 | $60,805 |
| 2015 | $1,286 | $89,650 | $38,172 | $51,478 |
| 2014 | $1,316 | $93,852 | $38,172 | $55,680 |
| 2013 | -- | $85,925 | $22,756 | $63,169 |
Source: Public Records
Map
Nearby Homes
- 1430 N 2100 W
- 1491 N 1875 W
- 1491 N 1875 W Unit 158
- 1487 N 1875 W
- 1487 N 1875 W Unit 159
- 1483 N 1875 W
- 1479 N 1875 W
- 1479 N 1875 W Unit 161
- 1452 N 1875 W Unit 146
- 1463 N 1875 W Unit 165
- 1463 N 1875 W
- 1459 N 1875 W
- 1459 N 1875 W Unit 166
- 1455 N 1875 W Unit 167
- 1451 N 1875 W Unit 168
- 1476 N 1875 W Unit 164
- 2115 W 1225 N
- 1477 N 2375 W
- 1937 W 1620 N
- 2438 W 1400 N